Garner: Fire Incidents, North Carolina (NC)
Where are fire incidents reported in Garner, NC
Something went wrong! Please refresh the page.
| Fire incidents reported | |
|---|---|
| Sreet name | Count |
| GARNER RD | 138 |
| I 40 | 126 |
| US 70 | 114 |
| TIMBER DR | 108 |
| US 70 HWY | 100 |
| SEVENTH AVE | 94 |
| FAYETTEVILLE RD | 92 |
| NC 42 HWY | 84 |
| BENSON RD | 70 |
| OLD STAGE RD | 62 |
| JONES SAUSAGE RD | 60 |
| CLEVELAND RD | 58 |
| CORNWALLIS RD | 58 |
| BRYAN PL | 56 |
| WHITE OAK RD | 56 |
| AVERSBORO RD | 50 |
| CREECH RD | 44 |
| PINEWINDS DR | 38 |
| SPRING DR | 36 |
| TEN TEN RD | 36 |
| OLD DRUG STORE RD | 34 |
| AUBURN CHURCH RD | 32 |
| GARNER STATION BLVD | 32 |
| PIERCE RD | 32 |
| SHENSTONE BLVD | 32 |
| MECHANICAL BLVD | 28 |
| RUPERT RD | 28 |
| GLEN RD | 26 |
| NEW BETHEL CHURCH RD | 26 |
| VANDORA SPRINGS RD | 26 |
| Other | 762 |
2002 - 2018 National Fire Incident Reporting System (NFIRS) incidents
- Incident types reported to NFIRS in Garner, NC
- 15,29557.0%Rescue & EMS
- 3,35512.5%Good Intent Call
- 2,5389.5%Fire
- 2,2598.4%Hazardous Condition
- 2,2308.3%False Alarm
- 1,0533.9%Service Call
- 620.2%Severe Weather
- Fire incident types reported to NFIRS in Garner, NC
- 1,04741.3%Structure Fires
- 90335.6%Outside Fires
- 54321.4%Mobile Property/Vehicle Fires
- 451.8%Other
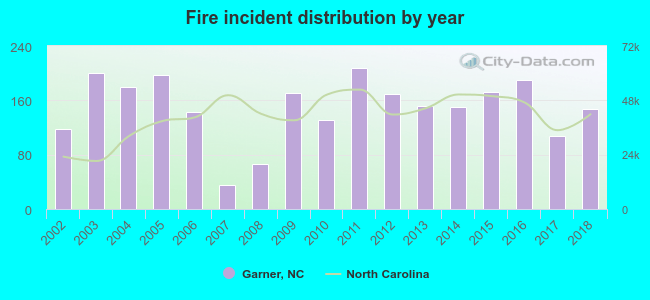 Based on the data from the years 2002 - 2018 the average number of fires per year is 149. The highest number of reported fire incidents - 208 took place in 2011, and the least - 35 in 2007. The data has a rising trend.
The average number of yearly fire incidents per 10k residents in Garner, NC compared to nearest cities:
(Note: Based on data for the last 3 years, including only cities with population 5,000 and above)
| Garner: | 53.3 |
| Raleigh: | 24.8 |
| Knightdale: | 119.9 |
| Clayton: | 129.0 |
| Cary: | 16.8 |
| Holly Springs: | 24.0 |
| Apex: | 26.2 |
| Morrisville: | 25.0 |
| Wendell: | 196.8 |
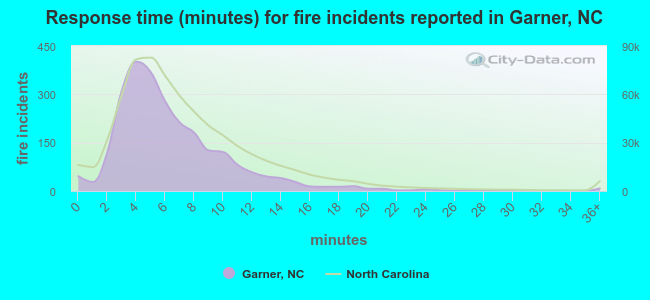 The median response time based on all reported fire incidents is 5 minutes. This is lower compared to the North Carolina median value.
The median response time in Garner, NC compared to nearest cities:
(Note: Based on data for all years, including only cities with at least 500 fire incidents)
| Garner: | 5 minutes |
| Raleigh: | 5 minutes |
| Knightdale: | 5 minutes |
| Clayton: | 8 minutes |
| Cary: | 5 minutes |
| Holly Springs: | 6 minutes |
| Fuquay-Varina: | 5 minutes |
| Apex: | 6 minutes |
| Angier: | 9 minutes |
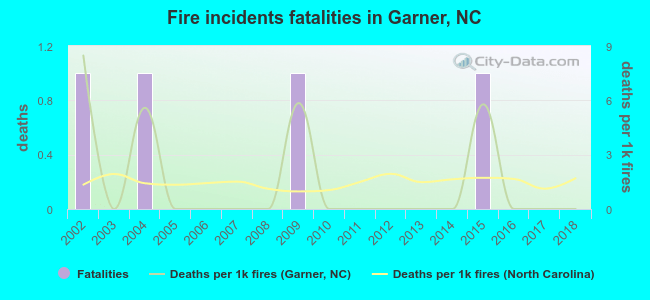 According to the reports from the years 2002 - 2018 the average number of fire-related yearly deaths is 0. The highest number of reported deaths - 1 took place in 2002, and the lowest - 0 in 2003. The data has a dropping trend.
The average number of deaths per 1,000 fire incidents is 2. This indicator was the highest - 8 in 2002, and the lowest 0 in 2003. The trend for deaths per 1,000 fires is declining. Compared to the North Carolina value the number of deaths per 1,000 fire incidents is about the same.
According to the reports from the years 2002 - 2018 the average number of fire-related yearly deaths is 0. The highest number of reported deaths - 1 took place in 2002, and the lowest - 0 in 2003. The data has a dropping trend.
The average number of deaths per 1,000 fire incidents is 2. This indicator was the highest - 8 in 2002, and the lowest 0 in 2003. The trend for deaths per 1,000 fires is declining. Compared to the North Carolina value the number of deaths per 1,000 fire incidents is about the same.Deaths per 1,000 incidents in Garner, NC compared to nearest cities:
(Note: Based on data for all years, including only cities with at least 2,500 fire incidents)
| Garner: | 1.6 |
| Raleigh: | 0.6 |
| Clayton: | 0.0 |
| Cary: | 1.1 |
| Wake Forest: | 0.0 |
| Lillington: | 2.1 |
| Durham: | 1.4 |
| Dunn: | 1.5 |
| Chapel Hill: | 0.5 |
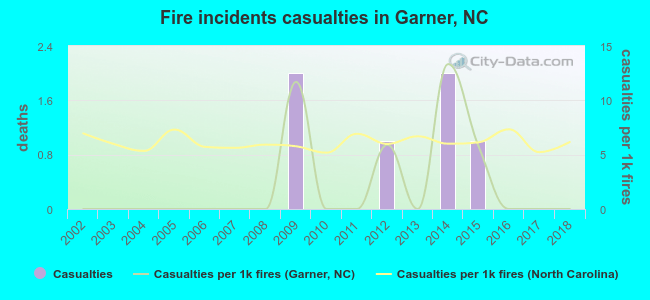 Based on the data from the years 2002 - 2018 the average number of fire-related casualties per year is 0. The highest number of injuries - 2 took place in 2009, and the lowest - 0 in 2002. The data has a constant trend.
The average number of injuries per 1,000 fire incidents is 2. This indicator was the highest - 13 in 2014, and the lowest 0 in 2002. The trend for casualties per 1,000 fires is constant. Compared to the state value the number of injuries per 1,000 incidents is much lower.
Based on the data from the years 2002 - 2018 the average number of fire-related casualties per year is 0. The highest number of injuries - 2 took place in 2009, and the lowest - 0 in 2002. The data has a constant trend.
The average number of injuries per 1,000 fire incidents is 2. This indicator was the highest - 13 in 2014, and the lowest 0 in 2002. The trend for casualties per 1,000 fires is constant. Compared to the state value the number of injuries per 1,000 incidents is much lower.Casualties per 1,000 incidents in Garner, NC compared to nearest cities:
(Note: Based on data for all years, including only cities with at least 500 fire incidents)
| Garner: | 2.4 |
| Raleigh: | 7.0 |
| Knightdale: | 12.1 |
| Clayton: | 0.5 |
| Cary: | 12.2 |
| Holly Springs: | 2.5 |
| Fuquay-Varina: | 2.7 |
| Apex: | 6.6 |
| Angier: | 1.1 |
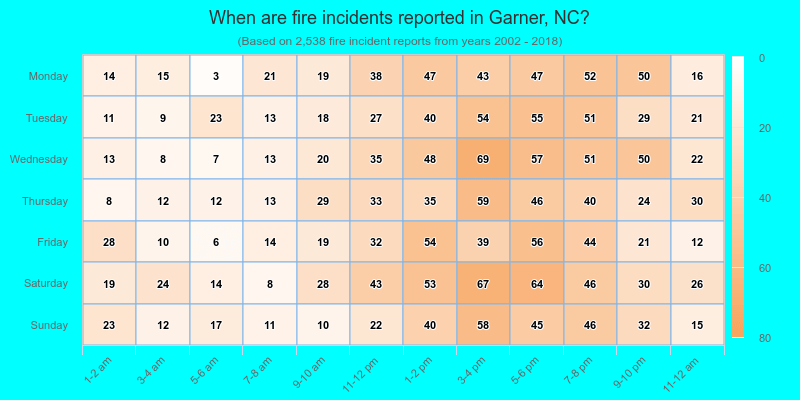
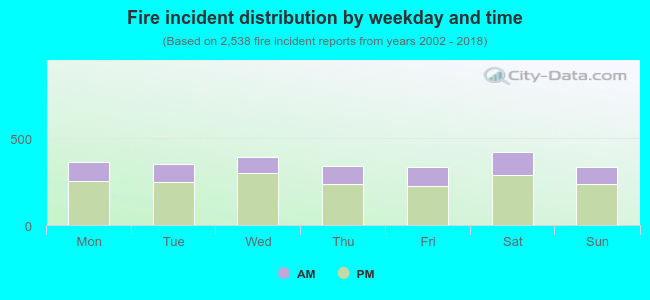 29.7% incidents where reported in the morning and 70.3% in the evening. The most fires (16.6%) took place on Saturday, and the least (13.0%) on Sunday.
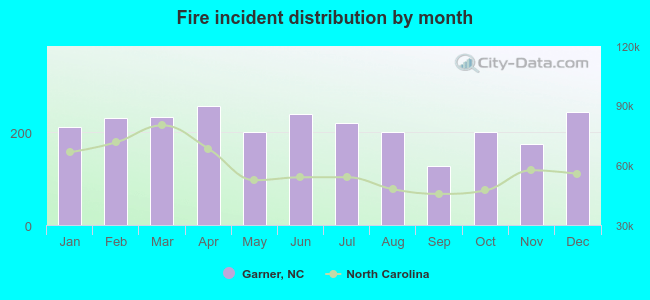 Based on the 2,538 fires from years 2002 - 2018 most fires (10.1%) took place during April, and the least (5.0%) in September.
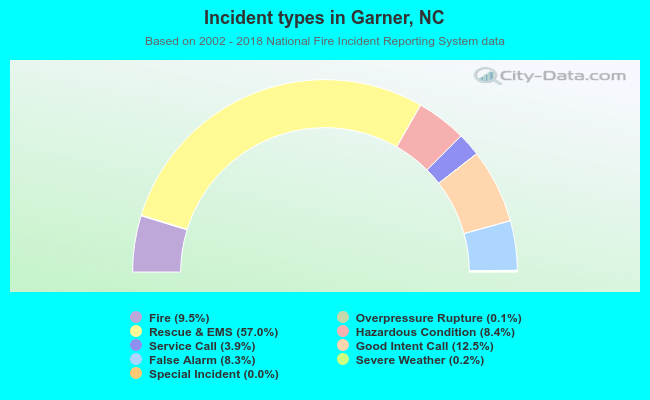 Out of all 26,823 cases reported during the years 2002 - 2018, the most belonged to the categories: Rescue & EMS (57.0%), Good Intent Call (12.5%), and Fire (9.5%).
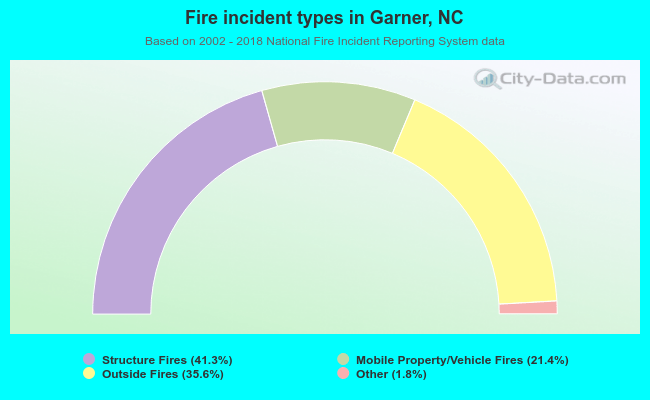 When looking into fire subcategories, the most reports belonged to: Structure Fires (41.3%), and Outside Fires (35.6%).