Apex: Fire Incidents, North Carolina (NC)
Where are fire incidents reported in Apex, NC
Something went wrong! Please refresh the page.
| Fire incidents reported | |
|---|---|
| Sreet name | Count |
| WILLIAMS ST | 116 |
| US HWY 1 | 72 |
| US 64 HWY | 50 |
| TEN TEN RD | 48 |
| HOLLY SPRINGS RD | 46 |
| SALEM ST | 44 |
| JOHNSON POND RD | 38 |
| TEN-TEN RD | 38 |
| US HWY 64 | 38 |
| SUNSET LAKE RD | 36 |
| OPTIMIST FARM RD | 34 |
| PENNY RD | 32 |
| FARRINGTON RD | 30 |
| OLD JENKS RD | 30 |
| OLD US 1 HWY | 30 |
| RHODES RD | 30 |
| LUFKIN RD | 28 |
| KELLY RD | 26 |
| LAURA DUNCAN RD | 26 |
| OPPORTUNITY LANE | 26 |
| CENTER ST | 24 |
| FRIENDSHIP RD | 24 |
| OLIVE CHAPEL RD | 24 |
| BEAVER CREEK RD | 22 |
| BELLS LAKE RD | 22 |
| OLD SMITHFIELD RD | 22 |
| PARK SUMMIT BLVD | 22 |
| DAVIS DR | 20 |
| HUGHES ST | 20 |
| NC HWY 751 | 20 |
| Other | 918 |
2002 - 2018 National Fire Incident Reporting System (NFIRS) incidents
- Incident types reported to NFIRS in Apex, NC
- 10,18546.6%Rescue & EMS
- 3,02113.8%Good Intent Call
- 2,93913.5%Hazardous Condition
- 2,25010.3%False Alarm
- 1,9569.0%Fire
- 1,2865.9%Service Call
- 1030.5%Severe Weather
- 650.3%Special Incident
- 370.2%Overpressure Rupture
- Fire incident types reported to NFIRS in Apex, NC
- 85343.6%Structure Fires
- 77339.5%Outside Fires
- 29415.0%Mobile Property/Vehicle Fires
- 361.8%Other
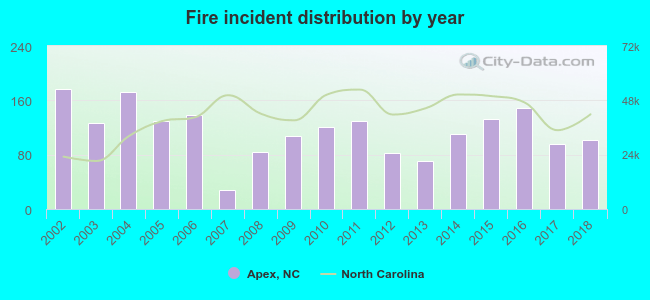 Based on the data from the years 2002 - 2018 the average number of fire incidents per year is 115. The highest number of reported fires - 177 took place in 2002, and the least - 28 in 2007. The data has a dropping trend.
The average number of yearly fire incidents per 10k residents in Apex, NC compared to nearest cities:
(Note: Based on data for the last 3 years, including only cities with population 5,000 and above)
| Apex: | 26.2 |
| Cary: | 16.8 |
| Holly Springs: | 24.0 |
| Morrisville: | 25.0 |
| Garner: | 53.3 |
| Raleigh: | 24.8 |
| Chapel Hill: | 39.1 |
| Durham: | 32.5 |
| Carrboro: | 29.5 |
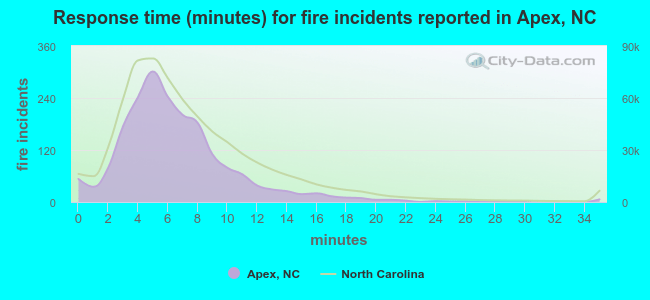 The median response time based on all reported fire incidents is 6 minutes. This is comparable to the state median value.
The median response time in Apex, NC compared to nearest cities:
(Note: Based on data for all years, including only cities with at least 500 fire incidents)
| Apex: | 6 minutes |
| Cary: | 5 minutes |
| Holly Springs: | 6 minutes |
| Morrisville: | 6 minutes |
| Fuquay-Varina: | 5 minutes |
| Garner: | 5 minutes |
| Raleigh: | 5 minutes |
| Angier: | 9 minutes |
| Chapel Hill: | 5 minutes |
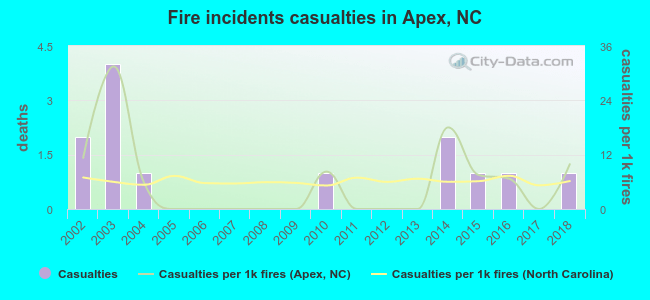 According to the reports from the years 2002 - 2018 the average number of fire-related casualties per year is 1. The highest number of injuries - 4 took place in 2003, and the lowest - 0 in 2005. The data has a declining trend.
The average number of injuries per 1,000 fires is 6. This indicator was the highest - 31 in 2003, and the lowest 0 in 2005. The trend for injuries per 1,000 fires is dropping. Compared to the state value the number of injuries per 1,000 fires is similar.
According to the reports from the years 2002 - 2018 the average number of fire-related casualties per year is 1. The highest number of injuries - 4 took place in 2003, and the lowest - 0 in 2005. The data has a declining trend.
The average number of injuries per 1,000 fires is 6. This indicator was the highest - 31 in 2003, and the lowest 0 in 2005. The trend for injuries per 1,000 fires is dropping. Compared to the state value the number of injuries per 1,000 fires is similar.Casualties per 1,000 incidents in Apex, NC compared to nearest cities:
(Note: Based on data for all years, including only cities with at least 500 fire incidents)
| Apex: | 6.6 |
| Cary: | 12.2 |
| Holly Springs: | 2.5 |
| Morrisville: | 6.8 |
| Fuquay-Varina: | 2.7 |
| Garner: | 2.4 |
| Raleigh: | 7.0 |
| Angier: | 1.1 |
| Chapel Hill: | 13.5 |
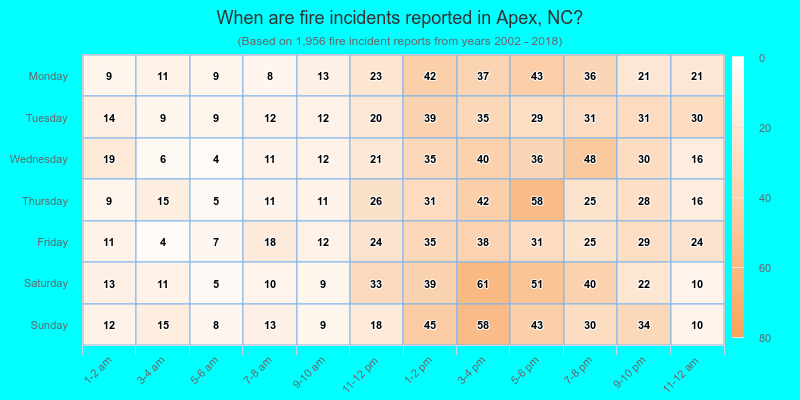
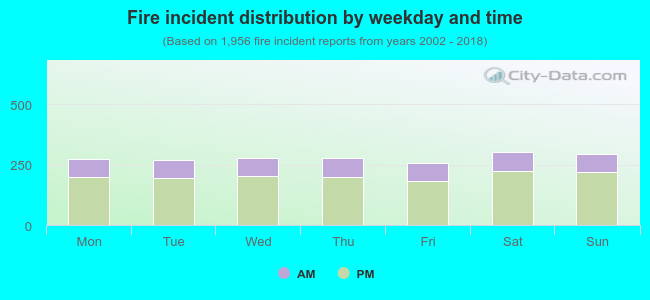 27.1% incidents where reported in the morning and 72.9% in the evening. The most fires (15.5%) took place on Saturday, and the least (13.2%) on Friday.
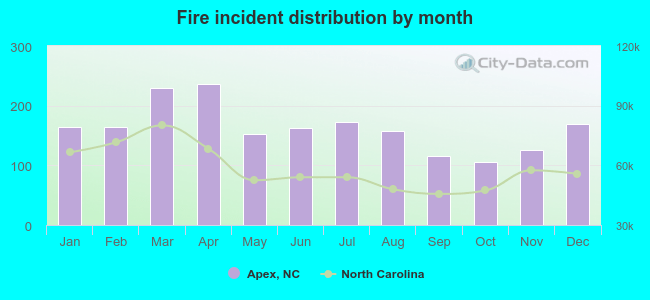 Based on the 1,956 reports from years 2002 - 2018 most fires (12.1%) took place during April, and the least (5.4%) in October.
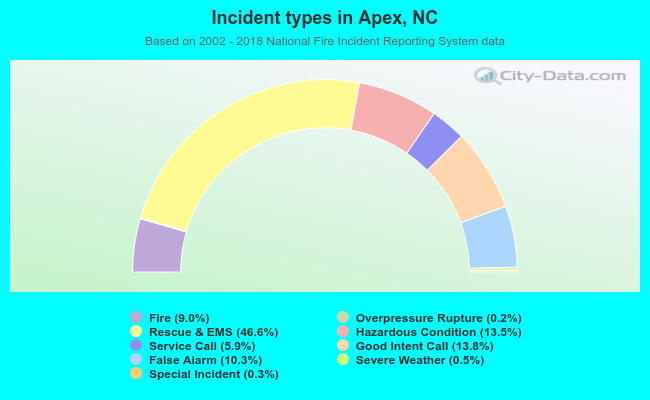 Out of all 21,842 cases reported during the years 2002 - 2018, the most belonged to the categories: Rescue & EMS (46.6%), Good Intent Call (13.8%), and Hazardous Condition (13.5%).
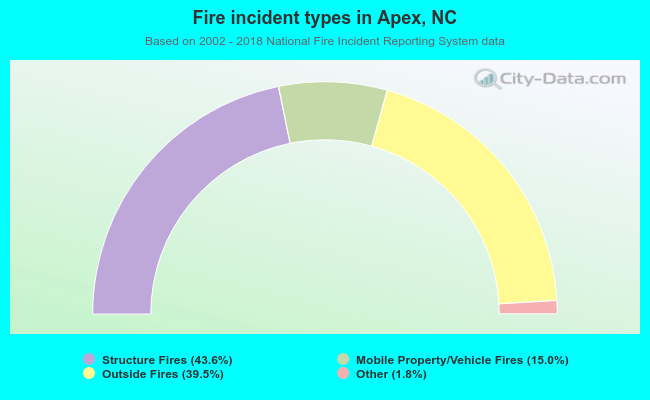 When looking into fire subcategories, the most incidents belonged to: Structure Fires (43.6%), and Outside Fires (39.5%).