Gas City: Fire Incidents, Indiana (IN)
Where are fire incidents reported in Gas City, IN
Something went wrong! Please refresh the page.
|
| |||||||||||||||||||||||||||||||||||||||||||||||||||||||||||||||||||||||||||||||||||||||||||||||||||||||||||||
2002 - 2017 National Fire Incident Reporting System (NFIRS) incidents
- Incident types reported to NFIRS in Gas City, IN
- 32340.9%Fire
- 21427.1%Hazardous Condition
- 759.5%Rescue & EMS
- 597.5%Good Intent Call
- 496.2%False Alarm
- 384.8%Service Call
- 151.9%Severe Weather
- 91.1%Overpressure Rupture
- 81.0%Special Incident
- Fire incident types reported to NFIRS in Gas City, IN
- 11335.0%Structure Fires
- 10733.1%Outside Fires
- 7222.3%Mobile Property/Vehicle Fires
- 319.6%Other
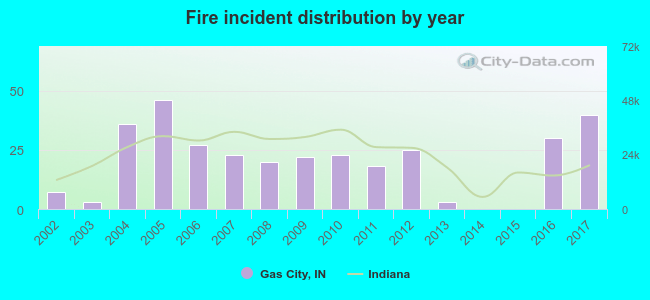 According to the data from the years 2002 - 2017 the average number of fire incidents per year is 20. The highest number of fire incidents - 46 took place in 2005, and the least - 0 in 2014. The data has an increasing trend.
The average number of yearly fire incidents per 10k residents in Gas City, IN compared to nearest cities:
(Note: Based on data for the last 3 years, including only cities with population 5,000 and above)
| Gas City: | 58.0 |
| Marion: | 53.6 |
| Hartford City: | 21.5 |
| Alexandria: | 16.4 |
| Elwood: | 24.8 |
| Yorktown: | 45.2 |
| Muncie: | 25.5 |
| Wabash: | 40.9 |
| Tipton: | 89.2 |
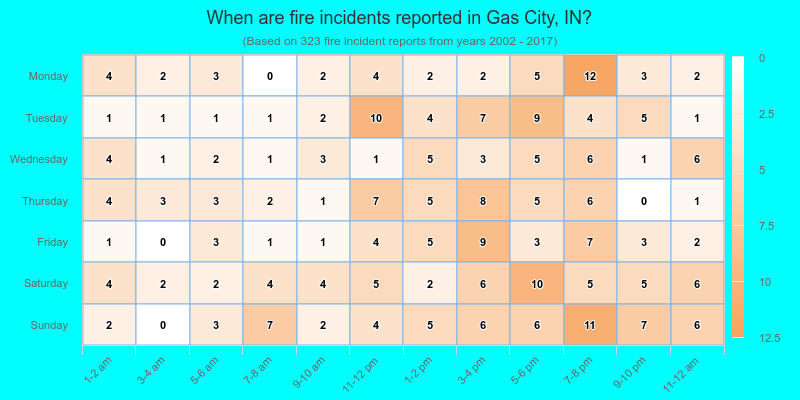
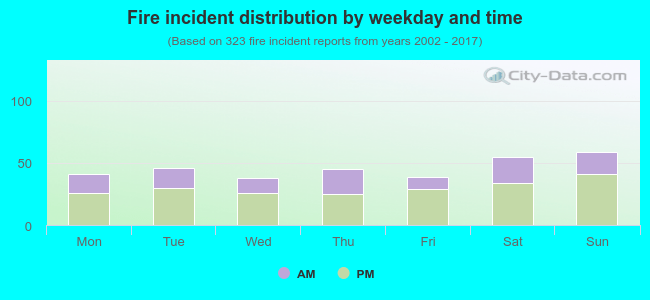 34.7% incidents where reported in the morning and 65.3% in the evening. The most fires (18.3%) took place on Sunday, and the least (11.8%) on Wednesday.
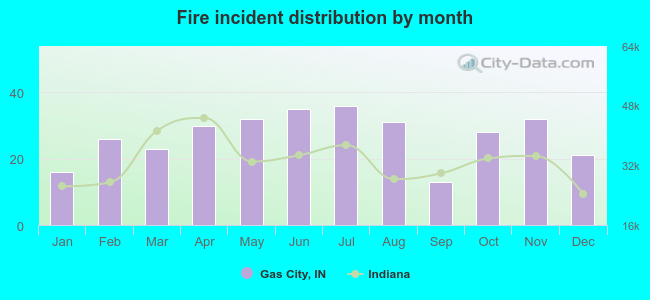 Based on the 323 fires from years 2002 - 2017 most fires (11.1%) took place during July, and the least (4.0%) in September.
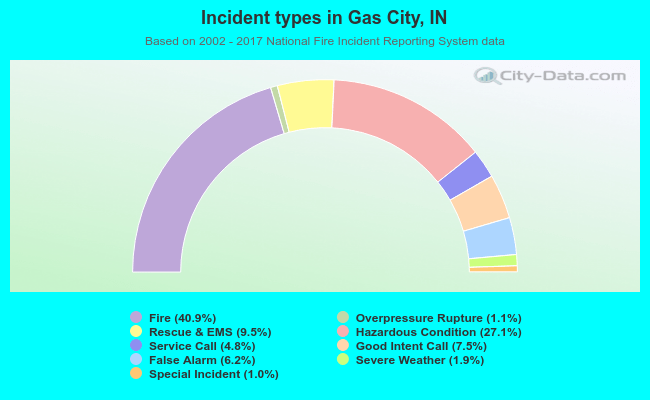 Out of all 790 cases reported during the years 2002 - 2017, the most belonged to the categories: Fire (40.9%), Hazardous Condition (27.1%), and Rescue & EMS (9.5%).
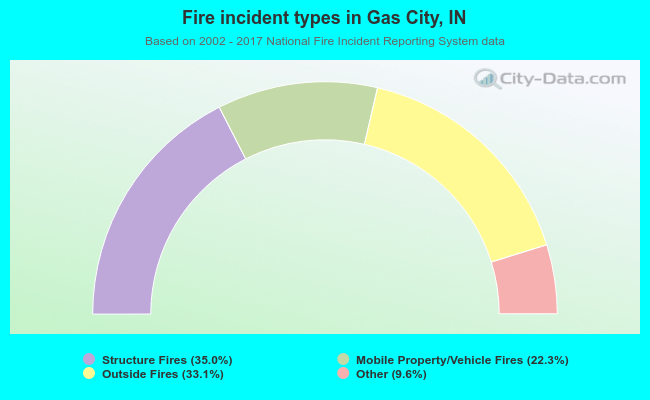 When looking into fire subcategories, the most reports belonged to: Structure Fires (35.0%), and Outside Fires (33.1%).