Marion: Fire Incidents, Indiana (IN)
Where are fire incidents reported in Marion, IN
Something went wrong! Please refresh the page.
| Fire incidents reported | |
|---|---|
| Sreet name | Count |
| WASHINGTON ST | 266 |
| ADAMS ST | 258 |
| BOOTS ST | 222 |
| 38TH ST | 210 |
| BRANSON ST | 188 |
| GALLATIN ST | 164 |
| MERIDIAN ST | 154 |
| WESTERN AVE | 142 |
| NEBRASKA ST | 140 |
| 10TH ST | 130 |
| BRADFORD ST | 130 |
| LINCOLN BLVD | 124 |
| 9TH ST | 116 |
| 11TH ST | 112 |
| MILLER AVE | 112 |
| 1ST ST | 110 |
| NELSON ST | 110 |
| 2ND ST | 108 |
| 8TH ST | 92 |
| CAREY ST | 90 |
| 3RD ST | 82 |
| 200 | 76 |
| GRANT ST | 74 |
| 12TH ST | 70 |
| BALDWIN AVE | 70 |
| 6TH ST | 64 |
| 400 | 62 |
| 100 | 60 |
| 500 | 60 |
| KEM RD | 58 |
| Other | 1,124 |
2002 - 2018 National Fire Incident Reporting System (NFIRS) incidents
- Incident types reported to NFIRS in Marion, IN
- 6,93837.2%Rescue & EMS
- 4,77825.6%Fire
- 2,98716.0%Hazardous Condition
- 1,5238.2%Service Call
- 1,2386.6%False Alarm
- 1,0435.6%Good Intent Call
- 460.2%Severe Weather
- 440.2%Overpressure Rupture
- 360.2%Special Incident
- Fire incident types reported to NFIRS in Marion, IN
- 2,32048.6%Outside Fires
- 1,73536.3%Structure Fires
- 53611.2%Mobile Property/Vehicle Fires
- 1873.9%Other
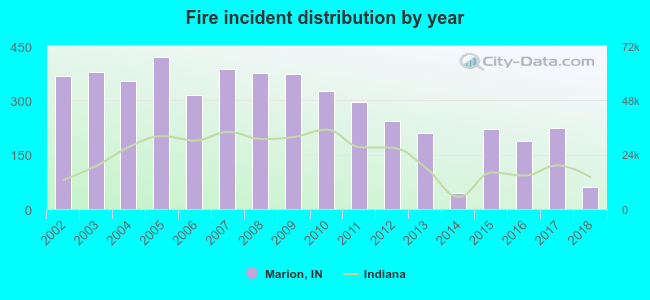 Based on the data from the years 2002 - 2018 the average number of fires per year is 281. The highest number of reported fire incidents - 420 took place in 2005, and the least - 44 in 2014. The data has a declining trend.
The average number of yearly fire incidents per 10k residents in Marion, IN compared to nearest cities:
(Note: Based on data for the last 3 years, including only cities with population 5,000 and above)
| Marion: | 53.6 |
| Gas City: | 58.0 |
| Hartford City: | 21.5 |
| Wabash: | 40.9 |
| Alexandria: | 16.4 |
| Elwood: | 24.8 |
| Huntington: | 30.9 |
| Kokomo: | 21.9 |
| Peru: | 4.5 |
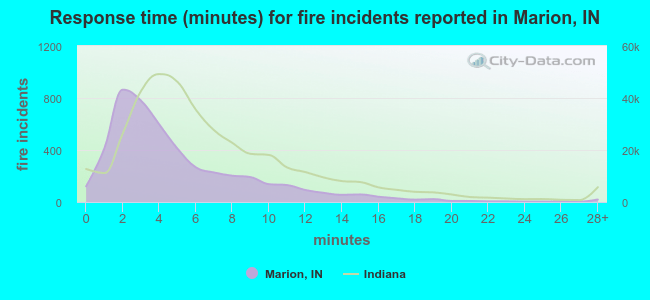 The median response time based on all reported fire incidents is 4 minutes. This is lower compared to the state median value.
The median response time in Marion, IN compared to nearest cities:
(Note: Based on data for all years, including only cities with at least 500 fire incidents)
| Marion: | 4 minutes |
| Greentown: | 10 minutes |
| Hartford City: | 3 minutes |
| Gaston: | 8 minutes |
| Wabash: | 5 minutes |
| Alexandria: | 5 minutes |
| Elwood: | 3 minutes |
| Huntington: | 4 minutes |
| Kokomo: | 5 minutes |
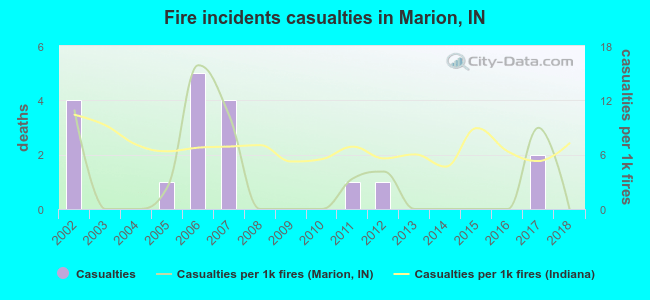 According to the data from the years 2002 - 2018 the average number of fire-related yearly casualties is 1. The highest number of casualties - 5 took place in 2006, and the lowest - 0 in 2003. The data has a decreasing trend.
The average number of casualties per 1,000 fires is 3. This indicator was the highest - 16 in 2006, and the lowest 0 in 2003. The trend for casualties per 1,000 fire incidents is declining. Compared to the Indiana value the number of casualties per 1,000 incidents is lower.
According to the data from the years 2002 - 2018 the average number of fire-related yearly casualties is 1. The highest number of casualties - 5 took place in 2006, and the lowest - 0 in 2003. The data has a decreasing trend.
The average number of casualties per 1,000 fires is 3. This indicator was the highest - 16 in 2006, and the lowest 0 in 2003. The trend for casualties per 1,000 fire incidents is declining. Compared to the Indiana value the number of casualties per 1,000 incidents is lower.Casualties per 1,000 incidents in Marion, IN compared to nearest cities:
(Note: Based on data for all years, including only cities with at least 500 fire incidents)
| Marion: | 3.8 |
| Greentown: | 0.0 |
| Hartford City: | 0.0 |
| Gaston: | 0.0 |
| Wabash: | 10.1 |
| Alexandria: | 25.3 |
| Elwood: | 6.6 |
| Huntington: | 14.6 |
| Kokomo: | 11.3 |
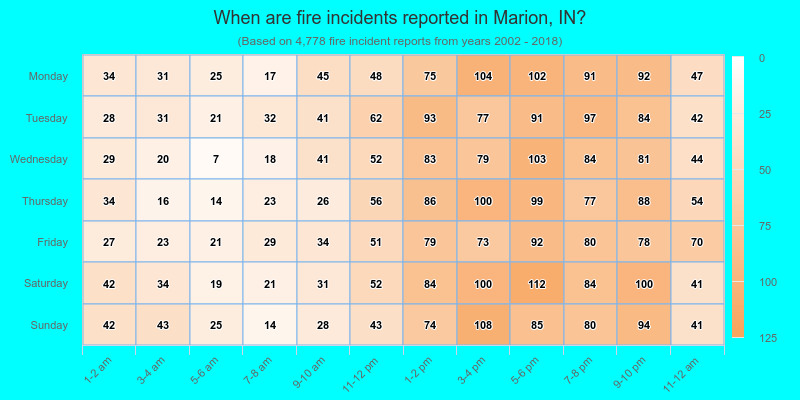
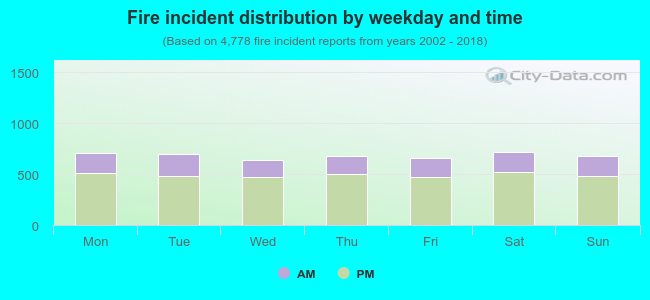 27.8% incidents where reported in the morning and 72.2% in the evening. The most fires (15.1%) took place on Saturday, and the least (13.4%) on Wednesday.
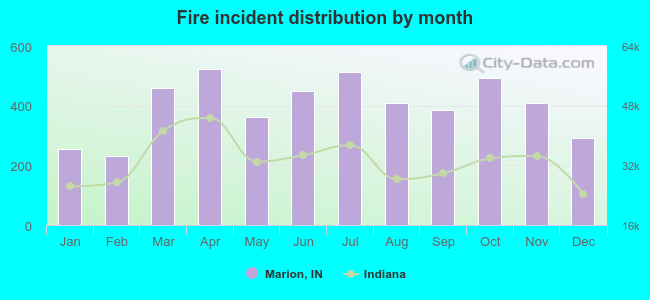 According to the 4,778 reports from years 2002 - 2018 most fires (10.9%) took place during April, and the least (4.8%) in February.
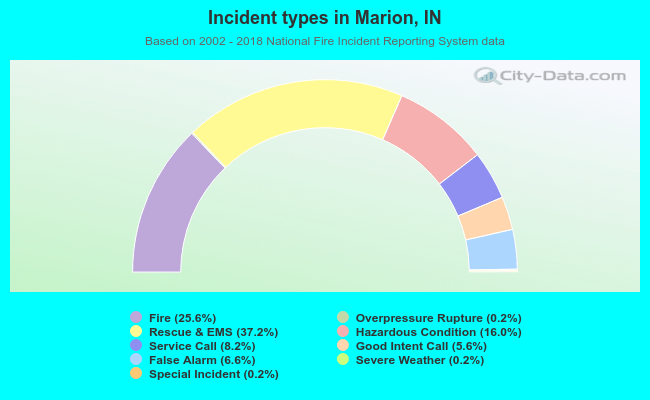 Out of all 18,633 cases reported during the years 2002 - 2018, the most belonged to the categories: Rescue & EMS (37.2%), Fire (25.6%), and Hazardous Condition (16.0%).
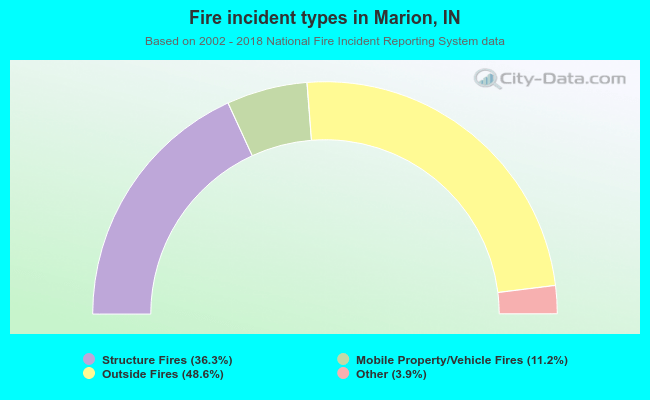 When looking into fire subcategories, the most incidents belonged to: Outside Fires (48.6%), and Structure Fires (36.3%).