Georgetown: Fire Incidents, Indiana (IN)
Where are fire incidents reported in Georgetown, IN
Something went wrong! Please refresh the page.
|
| |||||||||||||||||||||||||||||||||||||||||||||||||||||||||||||||||||||||||||||||||||||||||||||||||||||||||||||
2002 - 2018 National Fire Incident Reporting System (NFIRS) incidents
- Incident types reported to NFIRS in Georgetown, IN
- 1,08640.8%Rescue & EMS
- 79029.7%Fire
- 32912.4%Hazardous Condition
- 2168.1%Good Intent Call
- 1475.5%Service Call
- 732.7%False Alarm
- 110.4%Severe Weather
- 70.3%Special Incident
- Fire incident types reported to NFIRS in Georgetown, IN
- 30939.1%Outside Fires
- 30038.0%Structure Fires
- 13817.5%Mobile Property/Vehicle Fires
- 435.4%Other
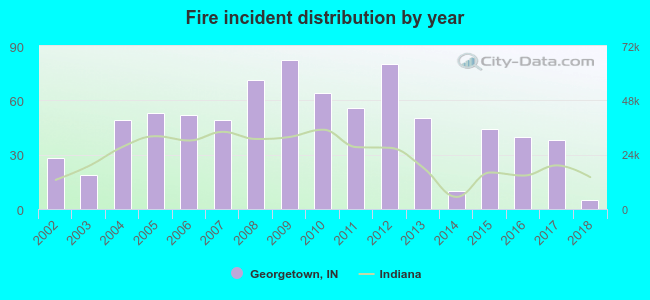 Based on the data from the years 2002 - 2018 the average number of fire incidents per year is 46. The highest number of fires - 82 took place in 2009, and the least - 5 in 2018. The data has a decreasing trend.
 The median response time based on all reported fire incidents is 6 minutes. This is similar to the Indiana median value.
The median response time in Georgetown, IN compared to nearest cities:
(Note: Based on data for all years, including only cities with at least 500 fire incidents)
| Georgetown: | 6 minutes |
| New Albany: | 4 minutes |
| Corydon: | 10 minutes |
| Clarksville: | 4 minutes |
| Jeffersonville: | 4 minutes |
| Sellersburg: | 6 minutes |
| Charlestown: | 7 minutes |
 25.9% incidents where reported in the morning and 74.1% in the evening. The most fires (17.8%) took place on Friday, and the least (11.8%) on Tuesday.
 According to the 790 reports from years 2002 - 2018 most fires (12.8%) took place during February, and the least (5.8%) in June.
 Out of all 2,661 cases reported during the years 2002 - 2018, the most belonged to the categories: Rescue & EMS (40.8%), Fire (29.7%), and Hazardous Condition (12.4%).
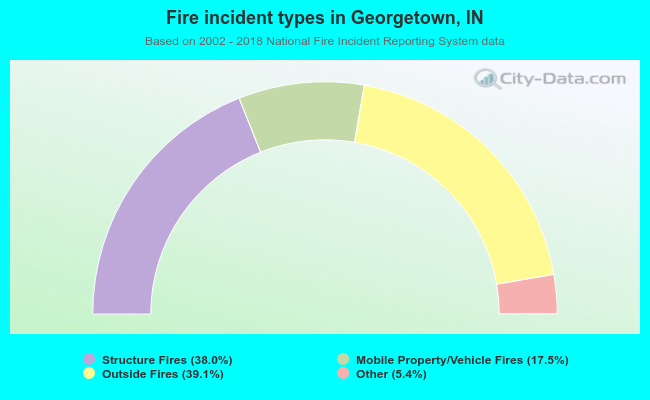 When looking into fire subcategories, the most incidents belonged to: Outside Fires (39.1%), and Structure Fires (38.0%).