Golden Valley: Fire Incidents, Minnesota (MN)
Where are fire incidents reported in Golden Valley, MN
Something went wrong! Please refresh the page.
| Fire incidents reported | |
|---|---|
| Sreet name | Count |
| GOLDEN VALLEY RD | 110 |
| OLSON MEMORIAL HWY | 102 |
| DOUGLAS DR | 90 |
| RHODE ISLAND AVE | 76 |
| WAYZATA BLVD | 62 |
| WINNETKA AVE | 52 |
| HWY 100 | 46 |
| LILAC DR | 42 |
| DULUTH ST | 38 |
| GLENWOOD AVE | 34 |
| I-394 | 34 |
| GENERAL MILLS BLVD | 28 |
| LOUISIANA AVE | 24 |
| UNITY AVE | 24 |
| COUNTRY CLUB DR | 22 |
| MEDICINE LAKE RD | 20 |
| PLYMOUTH AVE | 20 |
| REGENT AVE | 20 |
| ENSIGN AVE | 18 |
| JERSEY AVE | 18 |
| NOBLE AVE | 18 |
| FLORIDA AVE | 16 |
| MENDELSSOHN AVE | 16 |
| OTTAWA AVE | 16 |
| YOSEMITE CIR | 16 |
| GOLDEN HILLS DR | 14 |
| ORKLA DR | 14 |
| SUMTER AVE | 14 |
| XERXES AVE | 14 |
| ZEALAND AVE | 14 |
2002 - 2018 National Fire Incident Reporting System (NFIRS) incidents
- Incident types reported to NFIRS in Golden Valley, MN
- 1,62827.6%Hazardous Condition
- 1,21420.6%False Alarm
- 96716.4%Fire
- 81113.8%Rescue & EMS
- 79413.5%Good Intent Call
- 4367.4%Service Call
- 150.3%Special Incident
- 130.2%Severe Weather
- 110.2%Overpressure Rupture
- Fire incident types reported to NFIRS in Golden Valley, MN
- 50852.5%Structure Fires
- 21522.2%Outside Fires
- 21221.9%Mobile Property/Vehicle Fires
- 323.3%Other
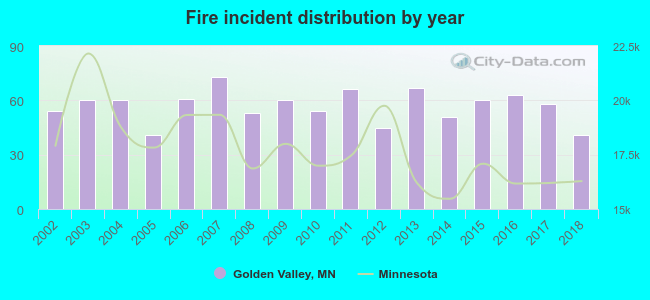 Based on the data from the years 2002 - 2018 the average number of fires per year is 57. The highest number of reported fire incidents - 73 took place in 2007, and the least - 41 in 2005. The data has a decreasing trend.
The average number of yearly fire incidents per 10k residents in Golden Valley, MN compared to nearest cities:
(Note: Based on data for the last 3 years, including only cities with population 5,000 and above)
| Golden Valley: | 25.9 |
| Robbinsdale: | 31.4 |
| Crystal: | 21.8 |
| New Hope: | 25.3 |
| Minneapolis: | 24.5 |
| Hopkins: | 30.1 |
| Plymouth: | 26.9 |
| Brooklyn Center: | 38.6 |
| Minnetonka: | 14.6 |
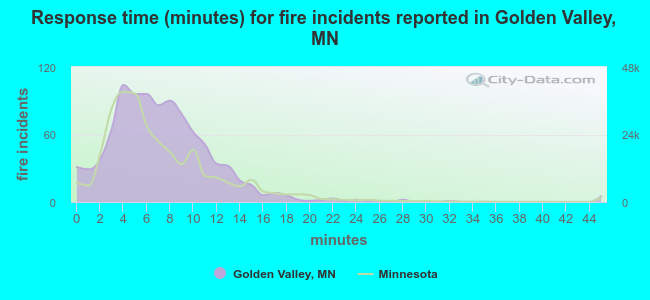 The median response time based on all reported fire incidents is 7 minutes. This is about the same as the Minnesota median value.
The median response time in Golden Valley, MN compared to nearest cities:
(Note: Based on data for all years, including only cities with at least 500 fire incidents)
| Golden Valley: | 7 minutes |
| Robbinsdale: | 6 minutes |
| Crystal: | 5 minutes |
| St. Louis Park: | 5 minutes |
| New Hope: | 5 minutes |
| Minneapolis: | 4 minutes |
| Hopkins: | 5 minutes |
| Plymouth: | 8 minutes |
| Brooklyn Center: | 6 minutes |
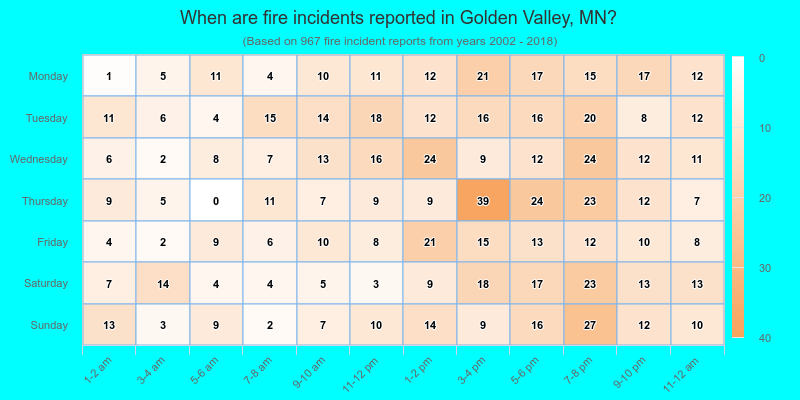
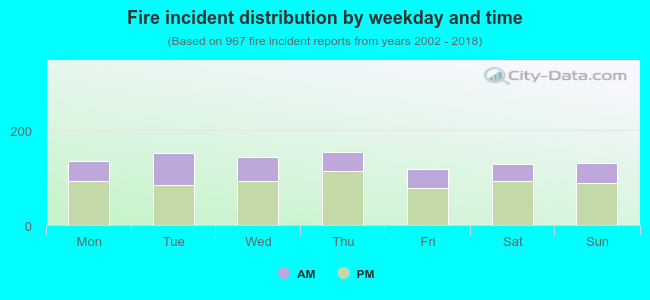 33.4% incidents where reported in the morning and 66.6% in the evening. The most fires (16.0%) took place on Thursday, and the least (12.2%) on Friday.
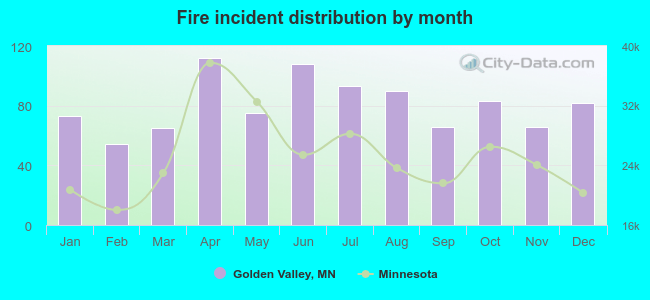 According to the 967 fires from years 2002 - 2018 most fires (11.6%) took place during April, and the least (5.6%) in February.
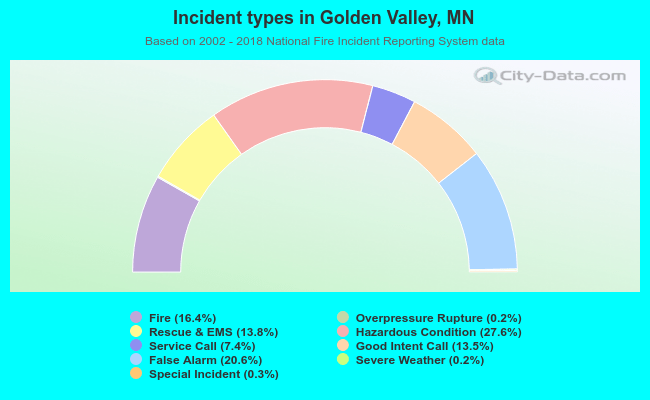 Out of all 5,889 cases reported during the years 2002 - 2018, the most belonged to the categories: Hazardous Condition (27.6%), False Alarm (20.6%), and Fire (16.4%).
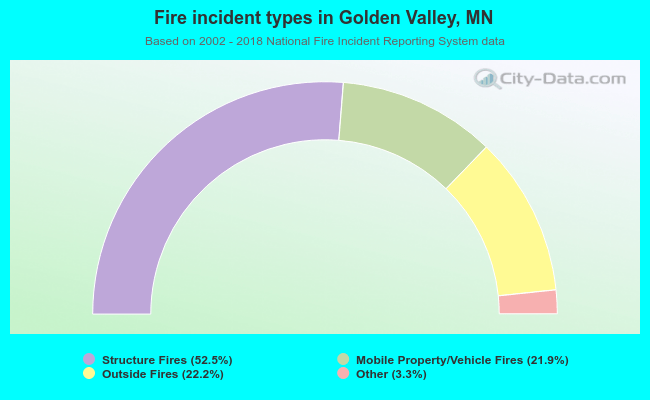 When looking into fire subcategories, the most reports belonged to: Structure Fires (52.5%), and Outside Fires (22.2%).