Hopkins: Fire Incidents, Minnesota (MN)
Where are fire incidents reported in Hopkins, MN
Something went wrong! Please refresh the page.
| Fire incidents reported | |
|---|---|
| Sreet name | Count |
| BLAKE RD | 136 |
| CAMBRIDGE ST | 88 |
| EXCELSIOR BLVD | 86 |
| 11TH AVE | 80 |
| 7TH AVE | 70 |
| 5TH AVE | 60 |
| LAKE ST | 54 |
| HWY 7 | 48 |
| 2ND ST | 46 |
| 8TH AVE | 42 |
| MAINSTREET | 36 |
| HWY 169 | 34 |
| 17TH AVE | 32 |
| 9TH AVE | 32 |
| FELTL CT | 32 |
| 6TH AVE | 26 |
| LANDMARK TRL | 26 |
| WESTBROOKE WAY | 26 |
| 13TH AVE | 22 |
| 2ND AVE | 22 |
| 12TH AVE | 20 |
| VAN BUREN AVE | 18 |
| SHADY OAK RD | 16 |
| TRAILWOOD | 16 |
| 10TH AVE | 14 |
| HIGHWAY 7 | 14 |
| MINNETONKA MILLS RD | 14 |
| SMETANA RD | 14 |
| 18TH AVE | 12 |
| 19TH AVE | 12 |
2002 - 2018 National Fire Incident Reporting System (NFIRS) incidents
- Incident types reported to NFIRS in Hopkins, MN
- 4,07651.6%Rescue & EMS
- 89811.4%Fire
- 86110.9%Hazardous Condition
- 79210.0%False Alarm
- 6708.5%Good Intent Call
- 5897.5%Service Call
- 90.1%Overpressure Rupture
- Fire incident types reported to NFIRS in Hopkins, MN
- 49855.5%Structure Fires
- 25628.5%Outside Fires
- 12113.5%Mobile Property/Vehicle Fires
- 232.6%Other
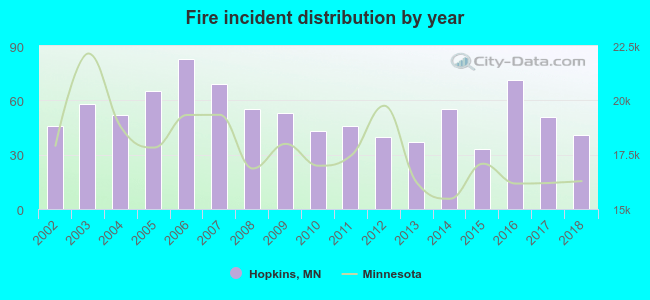 Based on the data from the years 2002 - 2018 the average number of fires per year is 53. The highest number of fires - 83 took place in 2006, and the least - 33 in 2015. The data has a decreasing trend.
The average number of yearly fire incidents per 10k residents in Hopkins, MN compared to nearest cities:
(Note: Based on data for the last 3 years, including only cities with population 5,000 and above)
| Hopkins: | 30.1 |
| Minnetonka: | 14.6 |
| Edina: | 18.1 |
| Golden Valley: | 25.9 |
| Eden Prairie: | 15.2 |
| Plymouth: | 26.9 |
| Richfield: | 20.8 |
| Minneapolis: | 24.5 |
| New Hope: | 25.3 |
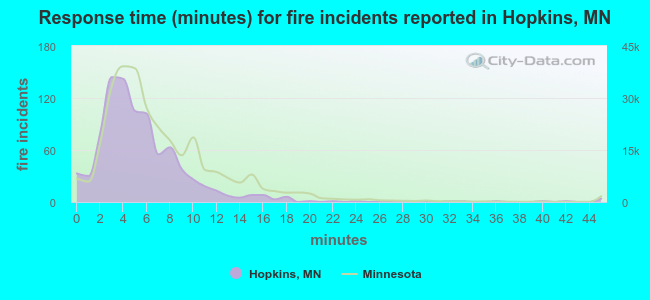 The median response time based on all reported fire incidents is 5 minutes. This is lower compared to the Minnesota median value.
The median response time in Hopkins, MN compared to nearest cities:
(Note: Based on data for all years, including only cities with at least 500 fire incidents)
| Hopkins: | 5 minutes |
| St. Louis Park: | 5 minutes |
| Minnetonka: | 7 minutes |
| Edina: | 5 minutes |
| Golden Valley: | 7 minutes |
| Eden Prairie: | 6 minutes |
| Plymouth: | 8 minutes |
| Richfield: | 4 minutes |
| Minneapolis: | 4 minutes |
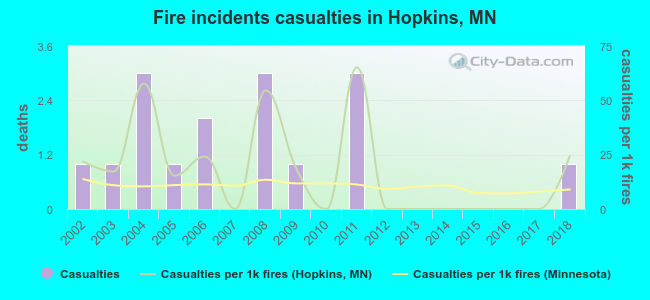 According to the data from the years 2002 - 2018 the average number of fire-related casualties per year is 1. The highest number of reported casualties - 3 took place in 2004, and the lowest - 0 in 2007. The data has a constant trend.
The average number of casualties per 1,000 fire incidents is 18. This indicator was the highest - 65 in 2011, and the lowest 0 in 2007. The trend for casualties per 1,000 fires is increasing. Compared to the state value the number of injuries per 1,000 fires is higher.
According to the data from the years 2002 - 2018 the average number of fire-related casualties per year is 1. The highest number of reported casualties - 3 took place in 2004, and the lowest - 0 in 2007. The data has a constant trend.
The average number of casualties per 1,000 fire incidents is 18. This indicator was the highest - 65 in 2011, and the lowest 0 in 2007. The trend for casualties per 1,000 fires is increasing. Compared to the state value the number of injuries per 1,000 fires is higher.Casualties per 1,000 incidents in Hopkins, MN compared to nearest cities:
(Note: Based on data for all years, including only cities with at least 500 fire incidents)
| Hopkins: | 17.8 |
| St. Louis Park: | 32.2 |
| Minnetonka: | 20.8 |
| Edina: | 40.5 |
| Golden Valley: | 2.1 |
| Eden Prairie: | 22.6 |
| Plymouth: | 18.6 |
| Richfield: | 20.5 |
| Minneapolis: | 17.0 |
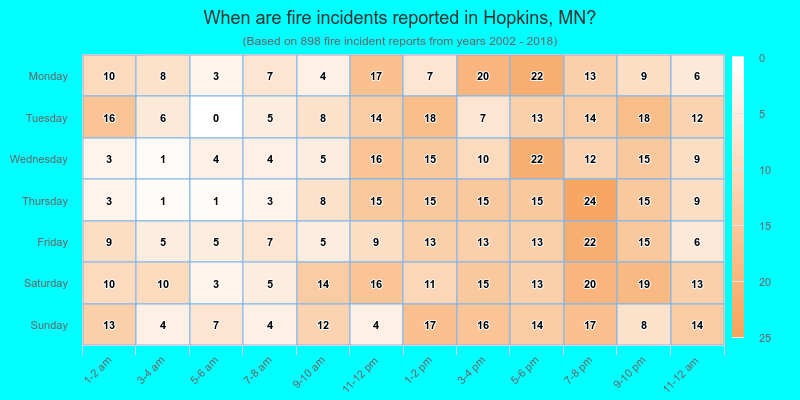
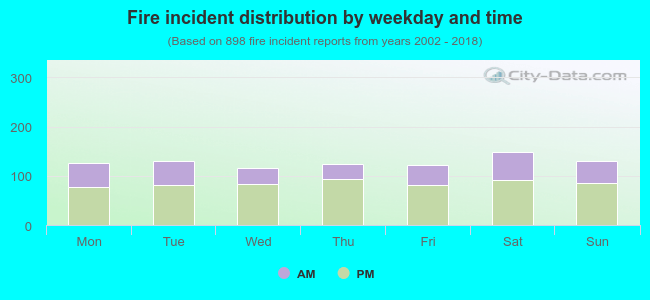 33.9% incidents where reported in the morning and 66.1% in the evening. The most fires (16.6%) took place on Saturday, and the least (12.9%) on Wednesday.
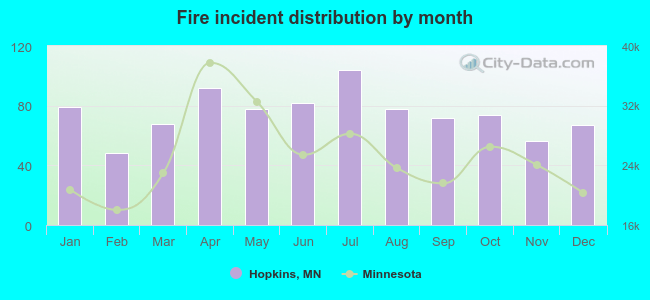 According to the 898 fire incident reports from years 2002 - 2018 most fires (11.6%) took place during July, and the least (5.3%) in February.
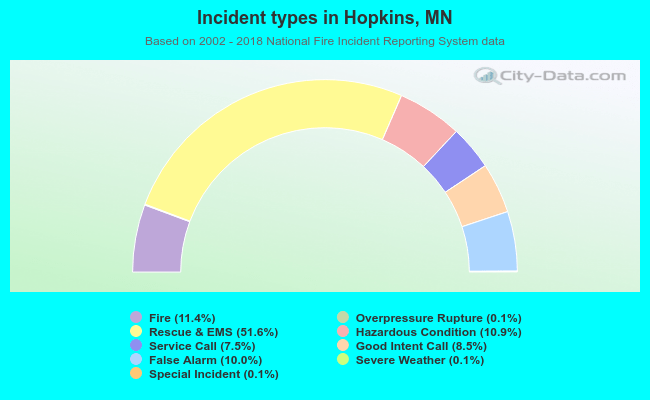 Out of all 7,905 cases reported during the years 2002 - 2018, the most belonged to the categories: Rescue & EMS (51.6%), Fire (11.4%), and Hazardous Condition (10.9%).
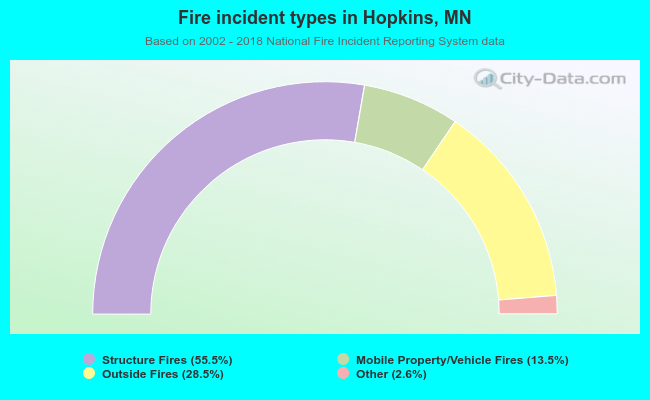 When looking into fire subcategories, the most reports belonged to: Structure Fires (55.5%), and Outside Fires (28.5%).