Greer: Fire Incidents, South Carolina (SC)
Where are fire incidents reported in Greer, SC
Something went wrong! Please refresh the page.
| Fire incidents reported | |
|---|---|
| Sreet name | Count |
| WADE HAMPTON BLVD | 380 |
| POINSETT ST | 156 |
| BUNCOMBE RD | 132 |
| JORDAN RD | 74 |
| CHANDLER RD | 72 |
| GAP CREEK RD | 72 |
| 14 HWY | 68 |
| MAIN ST | 66 |
| 101 HWY | 64 |
| HIGHWAY 101 HWY | 64 |
| ABNER CREEK RD | 52 |
| BRUSHY CREEK RD | 52 |
| BROCKMAN MCCLIMON RD | 50 |
| HIGHWAY 14 HWY | 50 |
| SUBER RD | 48 |
| HIGHWAY 101 | 44 |
| HWY 101 | 44 |
| VICTOR HILL RD | 44 |
| HWY 14 | 42 |
| GILLIAM RD | 40 |
| MEMORIAL DR | 36 |
| POPLAR DR | 36 |
| HARVEY RD | 34 |
| ARLINGTON RD | 32 |
| BEVERLY LN | 32 |
| HIGHWAY 14 | 32 |
| PELHAM RD | 32 |
| PENNINGTON RD | 32 |
| BERRY MILL RD | 30 |
| HAMMETT BRIDGE RD | 30 |
| Other | 1,903 |
2003 - 2018 National Fire Incident Reporting System (NFIRS) incidents
- Incident types reported to NFIRS in Greer, SC
- 13,99949.3%Rescue & EMS
- 3,84813.5%Fire
- 2,91710.3%Service Call
- 2,6419.3%Hazardous Condition
- 2,5649.0%Good Intent Call
- 2,2828.0%False Alarm
- 710.2%Special Incident
- 520.2%Severe Weather
- Fire incident types reported to NFIRS in Greer, SC
- 1,57040.9%Outside Fires
- 1,40036.4%Structure Fires
- 72919.0%Mobile Property/Vehicle Fires
- 1443.7%Other
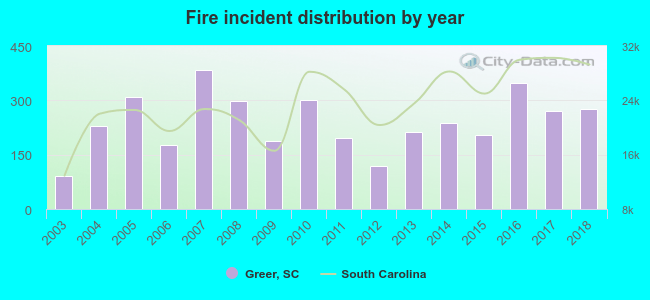 According to the data from the years 2003 - 2018 the average number of fire incidents per year is 240. The highest number of reported fire incidents - 385 took place in 2007, and the least - 90 in 2003. The data has a growing trend.
The average number of yearly fire incidents per 10k residents in Greer, SC compared to nearest cities:
(Note: Based on data for the last 3 years, including only cities with population 5,000 and above)
| Greer: | 107.6 |
| Taylors: | 61.7 |
| Gramling: | 1.6 |
| Greenville: | 183.0 |
| Mauldin: | 30.6 |
| Highland: | 1.7 |
| Simpsonville: | 61.9 |
| Berea: | 0.7 |
| Gantt: | 0.7 |
 The median response time based on all reported fire incidents is 5 minutes. This is lower compared to the state median value.
The median response time in Greer, SC compared to nearest cities:
(Note: Based on data for all years, including only cities with at least 500 fire incidents)
| Greer: | 5 minutes |
| Taylors: | 5 minutes |
| Duncan: | 6 minutes |
| Lyman: | 5 minutes |
| Wellford: | 7 minutes |
| Greenville: | 4 minutes |
| Inman: | 7 minutes |
| Mauldin: | 3 minutes |
| Travelers Rest: | 7 minutes |
 Based on the reports from the years 2003 - 2018 the average number of fire-related fatalities per year is 1. The highest number of deaths - 4 took place in 2004, and the lowest - 0 in 2003. The data has an increasing trend.
The average number of fatalities per 1,000 fires is 4. This indicator was the highest - 17 in 2004, and the lowest 0 in 2003. The trend for deaths per 1,000 incidents is growing. Compared to the South Carolina value the number of deaths per 1,000 fires is higher.
Based on the reports from the years 2003 - 2018 the average number of fire-related fatalities per year is 1. The highest number of deaths - 4 took place in 2004, and the lowest - 0 in 2003. The data has an increasing trend.
The average number of fatalities per 1,000 fires is 4. This indicator was the highest - 17 in 2004, and the lowest 0 in 2003. The trend for deaths per 1,000 incidents is growing. Compared to the South Carolina value the number of deaths per 1,000 fires is higher.Deaths per 1,000 incidents in Greer, SC compared to nearest cities:
(Note: Based on data for all years, including only cities with at least 2,500 fire incidents)
| Greer: | 3.9 |
| Greenville: | 1.8 |
| Spartanburg: | 2.0 |
| Easley: | 2.7 |
| Hendersonville: | 1.7 |
 Based on the reports from the years 2003 - 2018 the average number of fire-related casualties per year is 1. The highest number of reported casualties - 7 took place in 2018, and the lowest - 0 in 2003. The data has a rising trend.
The average number of injuries per 1,000 fire incidents is 5. This indicator was the highest - 25 in 2018, and the lowest 0 in 2003. The trend for casualties per 1,000 incidents is rising. Compared to the state value the number of injuries per 1,000 fire incidents is lower.
Based on the reports from the years 2003 - 2018 the average number of fire-related casualties per year is 1. The highest number of reported casualties - 7 took place in 2018, and the lowest - 0 in 2003. The data has a rising trend.
The average number of injuries per 1,000 fire incidents is 5. This indicator was the highest - 25 in 2018, and the lowest 0 in 2003. The trend for casualties per 1,000 incidents is rising. Compared to the state value the number of injuries per 1,000 fire incidents is lower.Casualties per 1,000 incidents in Greer, SC compared to nearest cities:
(Note: Based on data for all years, including only cities with at least 500 fire incidents)
| Greer: | 5.2 |
| Taylors: | 6.0 |
| Duncan: | 4.2 |
| Lyman: | 0.0 |
| Wellford: | 0.0 |
| Greenville: | 7.3 |
| Inman: | 4.3 |
| Mauldin: | 6.2 |
| Travelers Rest: | 1.5 |
 27.2% incidents where reported in the morning and 72.8% in the evening. The most fires (15.0%) took place on Saturday, and the least (13.5%) on Monday.
 According to the 3,843 reports from years 2003 - 2018 most fires (10.1%) took place during March, and the least (6.0%) in September.
 Out of all 28,402 cases reported during the years 2003 - 2018, the most belonged to the categories: Rescue & EMS (49.3%), Fire (13.5%), and Service Call (10.3%).
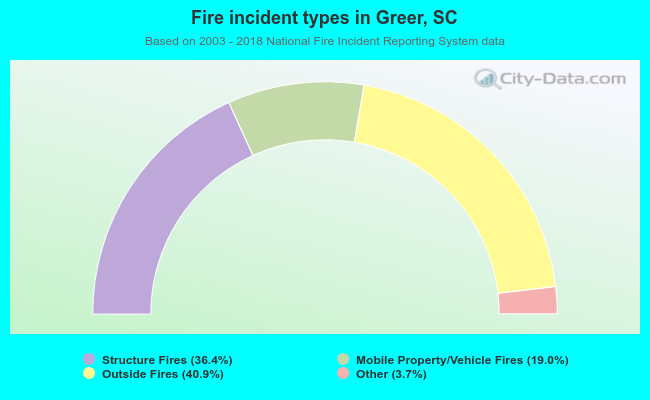 When looking into fire subcategories, the most reports belonged to: Outside Fires (40.9%), and Structure Fires (36.4%).