Simpsonville: Fire Incidents, South Carolina (SC)
Where are fire incidents reported in Simpsonville, SC
Something went wrong! Please refresh the page.
| Fire incidents reported | |
|---|---|
| Sreet name | Count |
| FAIRVIEW RD | 202 |
| MAIN ST | 196 |
| GRANDVIEW DR | 152 |
| GEORGIA RD | 104 |
| SCUFFLETOWN RD | 50 |
| BOYD AVE | 48 |
| INDUSTRIAL DR | 44 |
| NEELY FERRY RD | 42 |
| WOODRUFF RD | 42 |
| CAPEWOOD RD | 38 |
| I385 | 38 |
| SOUTH ST | 36 |
| STANDING SPRINGS RD | 32 |
| CURTIS ST | 30 |
| FORK SHOALS RD | 30 |
| HARRISON BRIDGE RD | 30 |
| MAPLE ST | 28 |
| DAVENPORT RD | 26 |
| JONESVILLE RD | 24 |
| ANDERSON RIDGE RD | 20 |
| ARBOR KEATS DR | 20 |
| RICHARDSON ST | 20 |
| BETHANY RD | 18 |
| EASTVIEW CIR | 18 |
| ALDER DR | 16 |
| BARKER RD | 16 |
| I-385 | 16 |
| MCKINNEY RD | 16 |
| NEW HARRISON BRIDGE RD | 16 |
| 14 HWY | 14 |
| Other | 494 |
2002 - 2018 National Fire Incident Reporting System (NFIRS) incidents
- Incident types reported to NFIRS in Simpsonville, SC
- 9,94753.1%Rescue & EMS
- 2,03310.8%Service Call
- 1,96010.5%False Alarm
- 1,87610.0%Fire
- 1,3997.5%Hazardous Condition
- 1,2116.5%Good Intent Call
- 2161.2%Severe Weather
- 650.3%Special Incident
- 320.2%Overpressure Rupture
- Fire incident types reported to NFIRS in Simpsonville, SC
- 77341.2%Outside Fires
- 62833.5%Structure Fires
- 32617.4%Mobile Property/Vehicle Fires
- 1497.9%Other
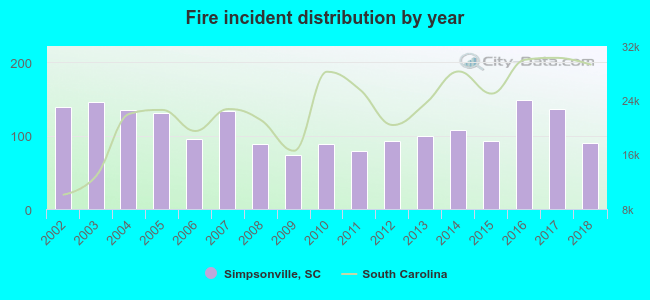 Based on the data from the years 2002 - 2018 the average number of fire incidents per year is 110. The highest number of reported fires - 148 took place in 2016, and the least - 73 in 2009. The data has a declining trend.
The average number of yearly fire incidents per 10k residents in Simpsonville, SC compared to nearest cities:
(Note: Based on data for the last 3 years, including only cities with population 5,000 and above)
| Simpsonville: | 61.9 |
| Mauldin: | 30.6 |
| Fountain Inn: | 150.0 |
| Gantt: | 0.7 |
| Greenville: | 183.0 |
| Piedmont: | 313.5 |
| Taylors: | 61.7 |
| Powderville: | 49.0 |
| Greer: | 107.6 |
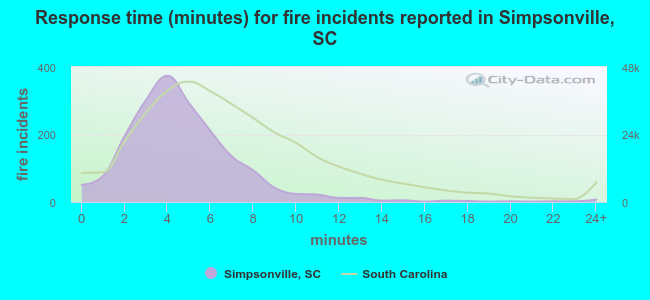 The median response time based on all reported fire incidents is 4 minutes. This is lower than the South Carolina median value.
The median response time in Simpsonville, SC compared to nearest cities:
(Note: Based on data for all years, including only cities with at least 500 fire incidents)
| Simpsonville: | 4 minutes |
| Mauldin: | 3 minutes |
| Fountain Inn: | 7 minutes |
| Greenville: | 4 minutes |
| Piedmont: | 6 minutes |
| Gray Court: | 10 minutes |
| Taylors: | 5 minutes |
| Woodruff: | 10 minutes |
| Pelzer: | 6 minutes |
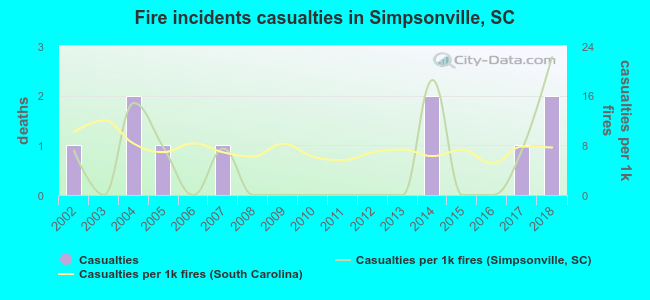 According to the data from the years 2002 - 2018 the average number of fire-related casualties per year is 1. The highest number of reported injuries - 2 took place in 2004, and the lowest - 0 in 2003. The data has an increasing trend.
The average number of injuries per 1,000 fires is 5. This indicator was the highest - 22 in 2018, and the lowest 0 in 2003. The trend for injuries per 1,000 incidents is rising. Compared to the state value the number of injuries per 1,000 incidents is lower.
According to the data from the years 2002 - 2018 the average number of fire-related casualties per year is 1. The highest number of reported injuries - 2 took place in 2004, and the lowest - 0 in 2003. The data has an increasing trend.
The average number of injuries per 1,000 fires is 5. This indicator was the highest - 22 in 2018, and the lowest 0 in 2003. The trend for injuries per 1,000 incidents is rising. Compared to the state value the number of injuries per 1,000 incidents is lower.Casualties per 1,000 incidents in Simpsonville, SC compared to nearest cities:
(Note: Based on data for all years, including only cities with at least 500 fire incidents)
| Simpsonville: | 5.3 |
| Mauldin: | 6.2 |
| Fountain Inn: | 4.5 |
| Greenville: | 7.3 |
| Piedmont: | 3.8 |
| Gray Court: | 4.1 |
| Taylors: | 6.0 |
| Woodruff: | 1.2 |
| Pelzer: | 1.4 |
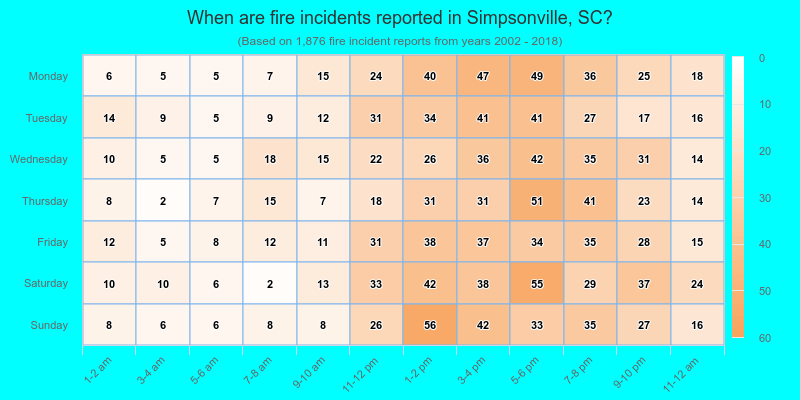
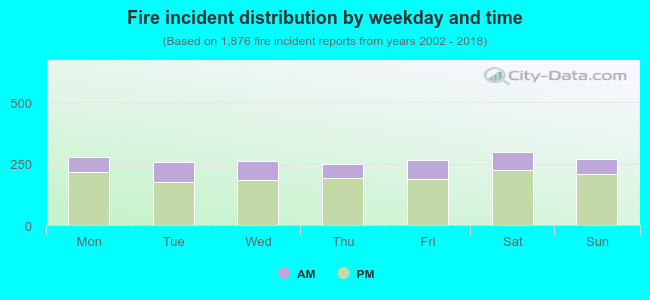 26.1% incidents where reported in the morning and 73.9% in the evening. The most fires (15.9%) took place on Saturday, and the least (13.2%) on Thursday.
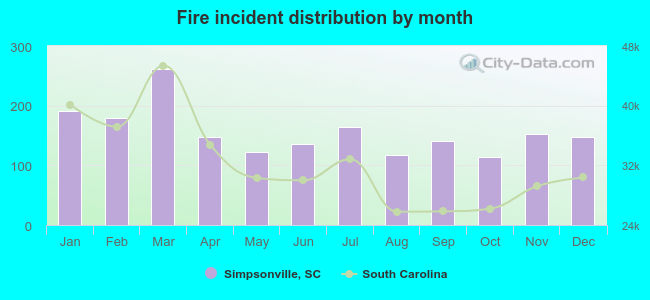 According to the 1,876 fires from years 2002 - 2018 most fires (14.0%) took place during March, and the least (6.1%) in October.
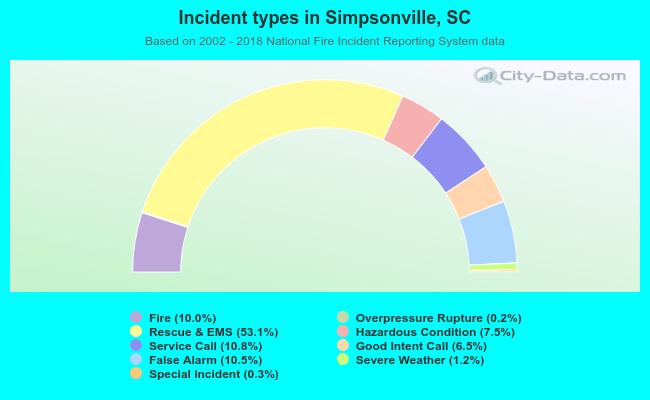 Out of all 18,739 cases reported during the years 2002 - 2018, the most belonged to the categories: Rescue & EMS (53.1%), Service Call (10.8%), and False Alarm (10.5%).
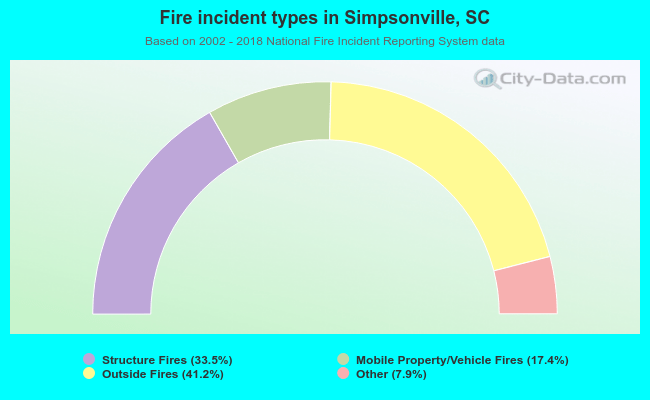 When looking into fire subcategories, the most incidents belonged to: Outside Fires (41.2%), and Structure Fires (33.5%).