Hanover: Fire Incidents, Pennsylvania (PA)
Where are fire incidents reported in Hanover, PA
Something went wrong! Please refresh the page.
| Fire incidents reported | |
|---|---|
| Sreet name | Count |
| CARLISLE ST | 294 |
| BALTIMORE ST | 236 |
| YORK ST | 180 |
| EISENHOWER DR | 146 |
| BROADWAY | 144 |
| HIGH ST | 128 |
| MIDDLE ST | 128 |
| FREDERICK ST | 80 |
| GRANDVIEW RD | 80 |
| BALTIMORE PIKE | 68 |
| WILSON AVE | 58 |
| FRANKLIN ST | 56 |
| WALNUT ST | 54 |
| CHESTNUT ST | 44 |
| UTZ TER | 42 |
| BLACK ROCK RD | 40 |
| BLETTNER AVE | 36 |
| POPLAR ST | 36 |
| BAER AVE | 34 |
| MOULSTOWN RD | 34 |
| PLEASANT ST | 34 |
| THIRD ST | 34 |
| HANOVER ST | 32 |
| PUMPING STATION RD | 32 |
| MCALLISTER ST | 30 |
| CENTENNIAL AVE | 28 |
| HANOVER ROAD | 28 |
| IMPOUNDING DAM RD | 28 |
| BECK MILL RD | 26 |
| CANNERY RD | 26 |
| Other | 470 |
2002 - 2018 National Fire Incident Reporting System (NFIRS) incidents
- Incident types reported to NFIRS in Hanover, PA
- 3,33828.3%Hazardous Condition
- 2,68622.7%Fire
- 2,18118.5%Rescue & EMS
- 1,41312.0%False Alarm
- 1,40811.9%Good Intent Call
- 6815.8%Service Call
- 620.5%Severe Weather
- 290.2%Special Incident
- 120.1%Overpressure Rupture
- Fire incident types reported to NFIRS in Hanover, PA
- 1,62360.4%Structure Fires
- 59722.2%Outside Fires
- 31111.6%Mobile Property/Vehicle Fires
- 1555.8%Other
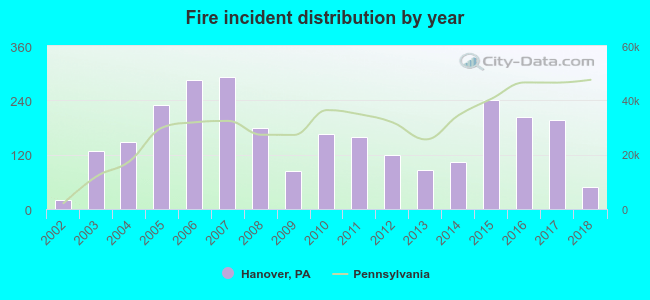 Based on the data from the years 2002 - 2018 the average number of fires per year is 158. The highest number of reported fires - 292 took place in 2007, and the least - 20 in 2002. The data has a growing trend.
The average number of yearly fire incidents per 10k residents in Hanover, PA compared to nearest cities:
(Note: Based on data for the last 3 years, including only cities with population 5,000 and above)
| Hanover: | 96.6 |
| Gettysburg: | 106.1 |
| York: | 121.7 |
| Red Lion: | 68.0 |
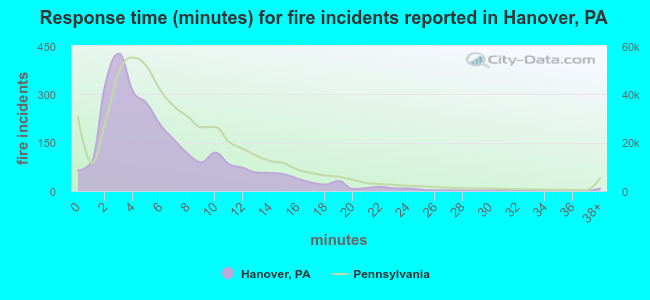 The median response time based on all reported fire incidents is 5 minutes. This is lower than the state median value.
The median response time in Hanover, PA compared to nearest cities:
(Note: Based on data for all years, including only cities with at least 500 fire incidents)
| Hanover: | 5 minutes |
| Spring Grove: | 10 minutes |
| Manchester: | 10 minutes |
| Gettysburg: | 11 minutes |
| Glen Rock: | 9 minutes |
| Taneytown: | 12 minutes |
| Hampstead: | 10 minutes |
| Dover: | 9 minutes |
| Westminster: | 10 minutes |
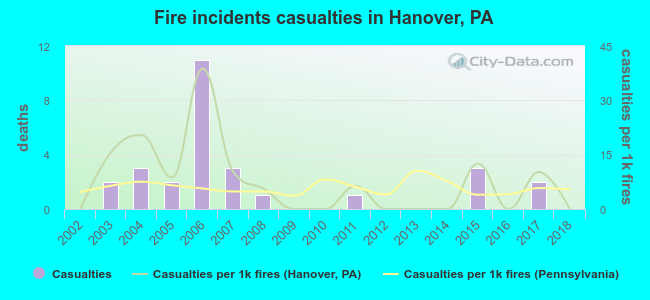 Based on the reports from the years 2002 - 2018 the average number of fire-related yearly casualties is 2. The highest number of casualties - 11 took place in 2006, and the lowest - 0 in 2002. The data has a constant trend.
The average number of injuries per 1,000 fire incidents is 8. This indicator was the highest - 39 in 2006, and the lowest 0 in 2002. The trend for injuries per 1,000 incidents is constant. Compared to the state value the number of casualties per 1,000 fires is higher.
Based on the reports from the years 2002 - 2018 the average number of fire-related yearly casualties is 2. The highest number of casualties - 11 took place in 2006, and the lowest - 0 in 2002. The data has a constant trend.
The average number of injuries per 1,000 fire incidents is 8. This indicator was the highest - 39 in 2006, and the lowest 0 in 2002. The trend for injuries per 1,000 incidents is constant. Compared to the state value the number of casualties per 1,000 fires is higher.Casualties per 1,000 incidents in Hanover, PA compared to nearest cities:
(Note: Based on data for all years, including only cities with at least 500 fire incidents)
| Hanover: | 10.4 |
| Spring Grove: | 2.3 |
| Manchester: | 1.1 |
| Gettysburg: | 4.4 |
| Glen Rock: | 5.0 |
| Taneytown: | 1.0 |
| Hampstead: | 3.2 |
| Dover: | 1.2 |
| Westminster: | 2.3 |
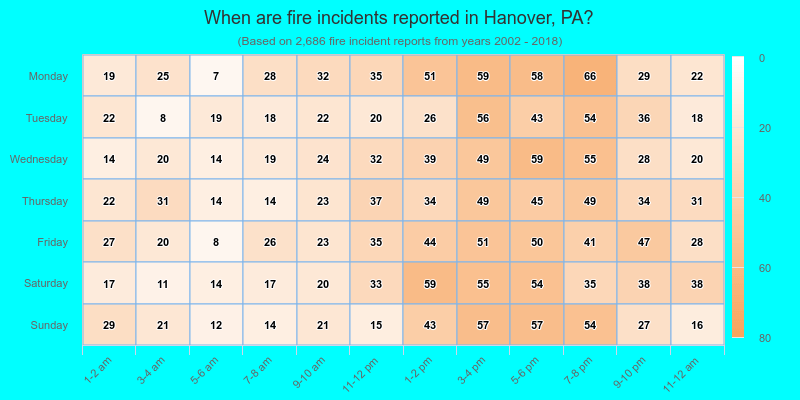
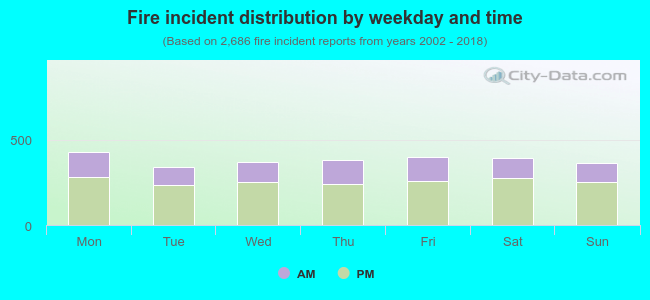 32.8% incidents where reported in the morning and 67.2% in the evening. The most fires (16.0%) took place on Monday, and the least (12.7%) on Tuesday.
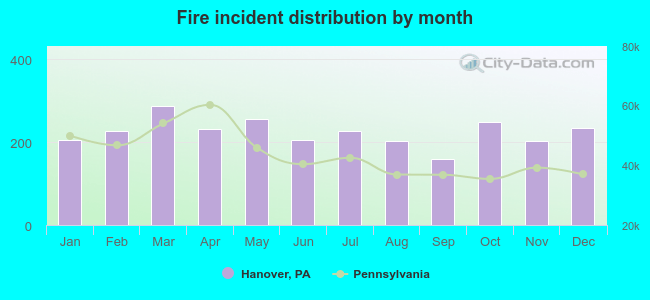 According to the 2,686 fires from years 2002 - 2018 most fires (10.7%) took place during March, and the least (6.0%) in September.
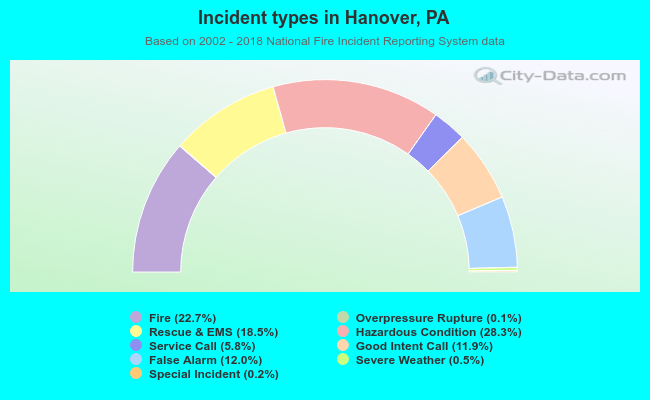 Out of all 11,810 cases reported during the years 2002 - 2018, the most belonged to the categories: Hazardous Condition (28.3%), Fire (22.7%), and Rescue & EMS (18.5%).
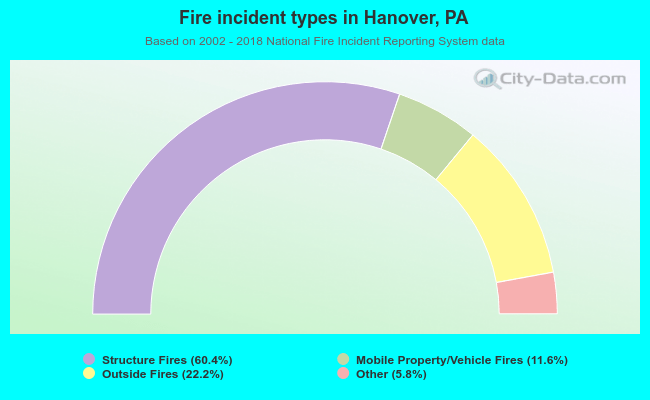 When looking into fire subcategories, the most reports belonged to: Structure Fires (60.4%), and Outside Fires (22.2%).