Red Lion: Fire Incidents, Pennsylvania (PA)
Where are fire incidents reported in Red Lion, PA
Something went wrong! Please refresh the page.
|
| |||||||||||||||||||||||||||||||||||||||||||||||||||||||||||||||||||||||||||||||||||||||||||||||||||||||||||||
2002 - 2018 National Fire Incident Reporting System (NFIRS) incidents
- Incident types reported to NFIRS in Red Lion, PA
- 1,14931.4%Hazardous Condition
- 1,04428.6%Fire
- 47212.9%Rescue & EMS
- 45912.6%Good Intent Call
- 3459.4%Service Call
- 1594.4%False Alarm
- 150.4%Severe Weather
- 80.2%Special Incident
- 40.1%Overpressure Rupture
- Fire incident types reported to NFIRS in Red Lion, PA
- 47445.4%Structure Fires
- 27626.4%Other
- 22921.9%Outside Fires
- 656.2%Mobile Property/Vehicle Fires
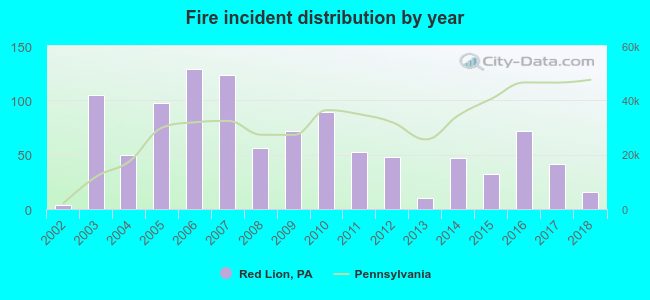 According to the data from the years 2002 - 2018 the average number of fires per year is 61. The highest number of fire incidents - 129 took place in 2006, and the least - 4 in 2002. The data has a growing trend.
The average number of yearly fire incidents per 10k residents in Red Lion, PA compared to nearest cities:
(Note: Based on data for the last 3 years, including only cities with population 5,000 and above)
| Red Lion: | 68.0 |
| York: | 121.7 |
| Columbia: | 89.6 |
| Millersville: | 27.5 |
| Mount Joy: | 82.4 |
| Elizabethtown: | 78.4 |
| Willow Street: | 31.7 |
| Lancaster: | 100.2 |
| Hanover: | 96.6 |
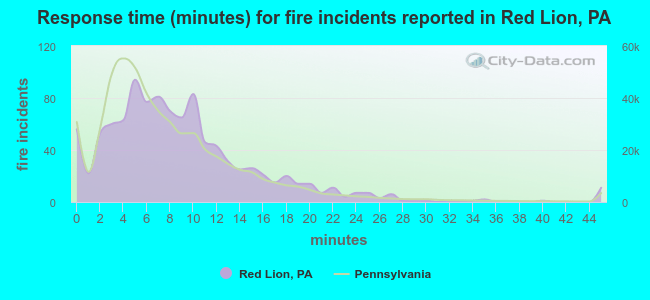 The median response time based on all reported fire incidents is 8 minutes. This is higher than the state median value.
The median response time in Red Lion, PA compared to nearest cities:
(Note: Based on data for all years, including only cities with at least 500 fire incidents)
| Red Lion: | 8 minutes |
| York: | 4 minutes |
| Wrightsville: | 9 minutes |
| Glen Rock: | 9 minutes |
| Shrewsbury: | 6 minutes |
| Stewartstown: | 9 minutes |
| Columbia: | 6 minutes |
| Marietta: | 8 minutes |
| Manchester: | 8 minutes |
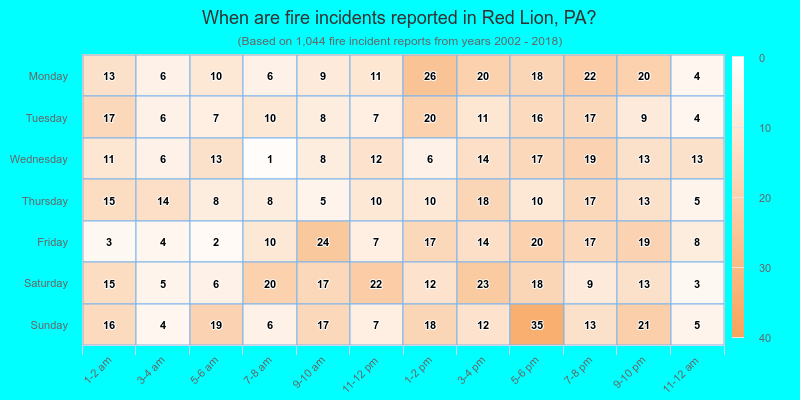
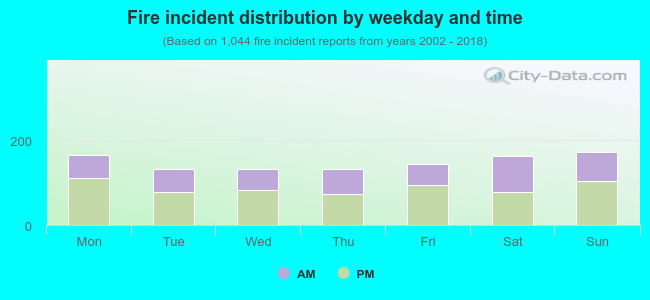 40.7% incidents where reported in the morning and 59.3% in the evening. The most fires (16.6%) took place on Sunday, and the least (12.6%) on Tuesday.
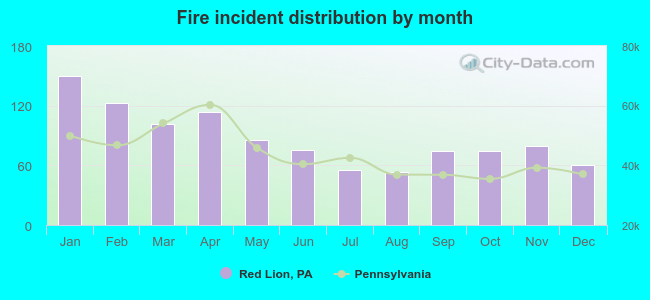 Based on the 1,044 fire incident reports from years 2002 - 2018 most fires (14.4%) took place during January, and the least (5.1%) in August.
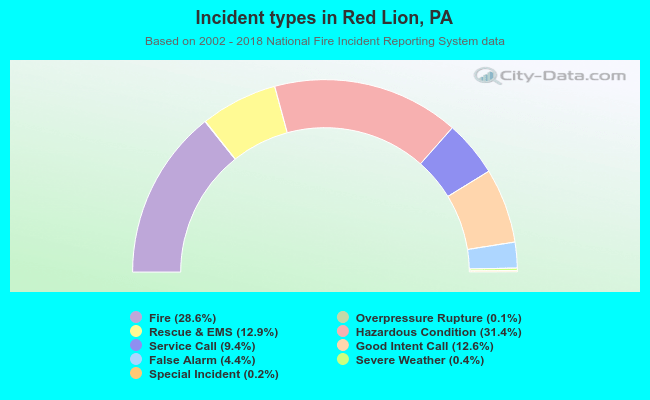 Out of all 3,655 cases reported during the years 2002 - 2018, the most belonged to the categories: Hazardous Condition (31.4%), Fire (28.6%), and Rescue & EMS (12.9%).
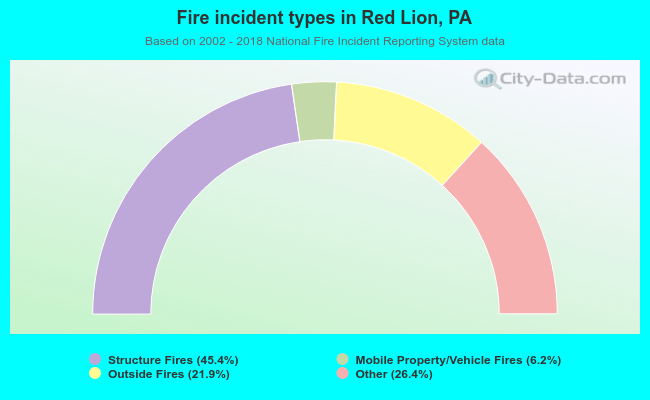 When looking into fire subcategories, the most reports belonged to: Structure Fires (45.4%), and Other (26.4%).