Harrisburg: Fire Incidents, South Dakota (SD)
Where are fire incidents reported in Harrisburg, SD
Something went wrong! Please refresh the page.
|
| |||||||||||||||||||||||||||||||||||||||||||||||||||||||||||||||||||||||||||||||||||||||||||||||||||||||||||||
| Other | 155 | |||||||||||||||||||||||||||||||||||||||||||||||||||||||||||||||||||||||||||||||||||||||||||||||||||||||||||||
2003 - 2018 National Fire Incident Reporting System (NFIRS) incidents
- Incident types reported to NFIRS in Harrisburg, SD
- 33835.9%Good Intent Call
- 27529.2%Fire
- 16017.0%Rescue & EMS
- 758.0%False Alarm
- 616.5%Hazardous Condition
- 192.0%Service Call
- 60.6%Severe Weather
- 40.4%Overpressure Rupture
- 30.3%Special Incident
- Fire incident types reported to NFIRS in Harrisburg, SD
- 14251.6%Outside Fires
- 7426.9%Structure Fires
- 3713.5%Mobile Property/Vehicle Fires
- 228.0%Other
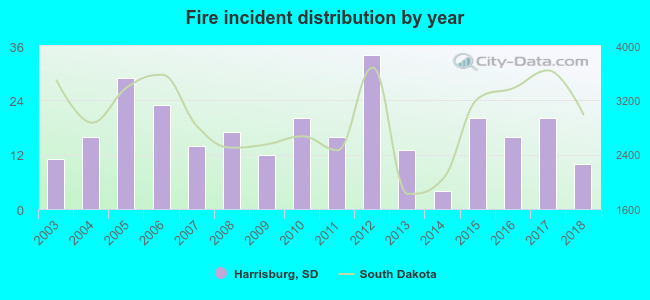 According to the data from the years 2003 - 2018 the average number of fires per year is 17. The highest number of fire incidents - 34 took place in 2012, and the least - 4 in 2014. The data has a declining trend.
The average number of yearly fire incidents per 10k residents in Harrisburg, SD compared to nearest cities:
(Note: Based on data for the last 3 years, including only cities with population 5,000 and above)
| Harrisburg: | 29.5 |
| Sioux Falls: | 19.9 |
| Brandon: | 31.4 |

 19.6% incidents where reported in the morning and 80.4% in the evening. The most fires (16.7%) took place on Tuesday, and the least (11.6%) on Monday.
 Based on the 275 fire incidents from years 2003 - 2018 most fires (16.4%) took place during July, and the least (3.6%) in January.
 Out of all 941 cases reported during the years 2003 - 2018, the most belonged to the categories: Good Intent Call (35.9%), Fire (29.2%), and Rescue & EMS (17.0%).
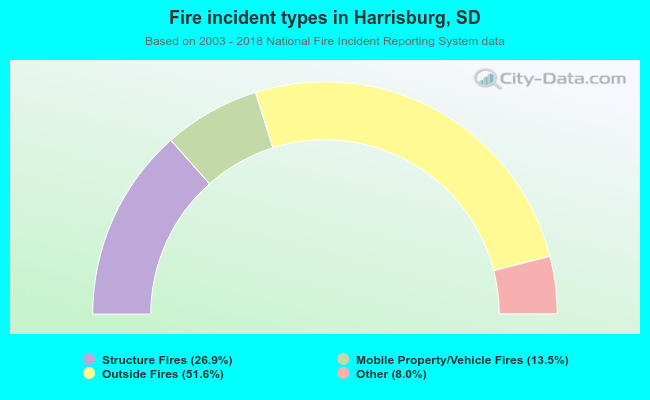 When looking into fire subcategories, the most incidents belonged to: Outside Fires (51.6%), and Structure Fires (26.9%).