Sioux Falls: Fire Incidents, South Dakota (SD)
Where are fire incidents reported in Sioux Falls, SD
Something went wrong! Please refresh the page.
| Fire incidents reported | |
|---|---|
| Sreet name | Count |
| 12TH ST | 318 |
| 41ST ST | 224 |
| 10TH ST | 202 |
| CLIFF AVE | 184 |
| MINNESOTA AVE | 178 |
| 26TH ST | 152 |
| 6TH ST | 146 |
| CLEVELAND AVE | 130 |
| 8TH ST | 124 |
| LOUISE AVE | 118 |
| MADISON ST | 114 |
| DAKOTA AVE | 110 |
| SPRING AVE | 108 |
| WESTERN AVE | 100 |
| DULUTH AVE | 98 |
| 11TH ST | 96 |
| 4TH AVE | 96 |
| SUMMIT AVE | 90 |
| MARION RD | 86 |
| 229 | 84 |
| 57TH ST | 82 |
| WEST AVE | 80 |
| 60TH ST | 78 |
| 18TH ST | 74 |
| KIWANIS AVE | 74 |
| PHILLIPS AVE | 68 |
| WEBER AVE | 68 |
| 3RD ST | 66 |
| BENSON RD | 66 |
| MAIN AVE | 66 |
| Other | 1,139 |
2002 - 2018 National Fire Incident Reporting System (NFIRS) incidents
- Incident types reported to NFIRS in Sioux Falls, SD
- 26,20440.9%Rescue & EMS
- 12,66019.7%Hazardous Condition
- 7,58311.8%Good Intent Call
- 6,3369.9%False Alarm
- 5,9619.3%Service Call
- 4,6197.2%Fire
- 6981.1%Special Incident
- Fire incident types reported to NFIRS in Sioux Falls, SD
- 2,05244.4%Structure Fires
- 1,34329.1%Outside Fires
- 1,10523.9%Mobile Property/Vehicle Fires
- 1192.6%Other
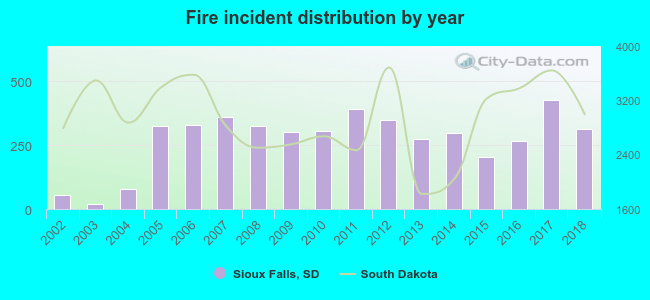 Based on the data from the years 2002 - 2018 the average number of fire incidents per year is 272. The highest number of reported fire incidents - 426 took place in 2017, and the least - 21 in 2003. The data has an increasing trend.
The average number of yearly fire incidents per 10k residents in Sioux Falls, SD compared to nearest cities:
(Note: Based on data for the last 3 years, including only cities with population 5,000 and above)
| Sioux Falls: | 19.9 |
| Harrisburg: | 29.5 |
| Brandon: | 31.4 |
| Madison: | 33.7 |
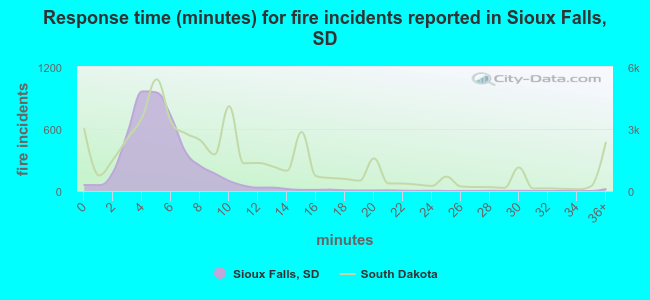 The median response time based on all reported fire incidents is 5 minutes. This is lower than the South Dakota median value.
The median response time in Sioux Falls, SD compared to nearest cities:
(Note: Based on data for all years, including only cities with at least 500 fire incidents)
| Sioux Falls: | 5 minutes |
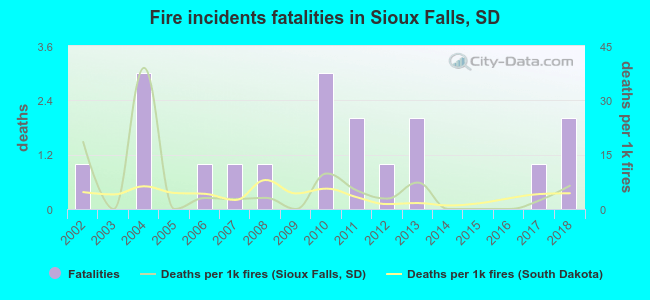 According to the reports from the years 2002 - 2018 the average number of fire-related fatalities per year is 1. The highest number of reported deaths - 3 took place in 2004, and the lowest - 0 in 2003. The data has a growing trend.
The average number of deaths per 1,000 fire incidents is 6. This indicator was the highest - 39 in 2004, and the lowest 0 in 2003. The trend for deaths per 1,000 fire incidents is dropping. Compared to the South Dakota value the number of fatalities per 1,000 fire incidents is similar.
According to the reports from the years 2002 - 2018 the average number of fire-related fatalities per year is 1. The highest number of reported deaths - 3 took place in 2004, and the lowest - 0 in 2003. The data has a growing trend.
The average number of deaths per 1,000 fire incidents is 6. This indicator was the highest - 39 in 2004, and the lowest 0 in 2003. The trend for deaths per 1,000 fire incidents is dropping. Compared to the South Dakota value the number of fatalities per 1,000 fire incidents is similar.Deaths per 1,000 incidents in Sioux Falls, SD compared to nearest cities:
(Note: Based on data for all years, including only cities with at least 2,500 fire incidents)
| Sioux Falls: | 3.9 |
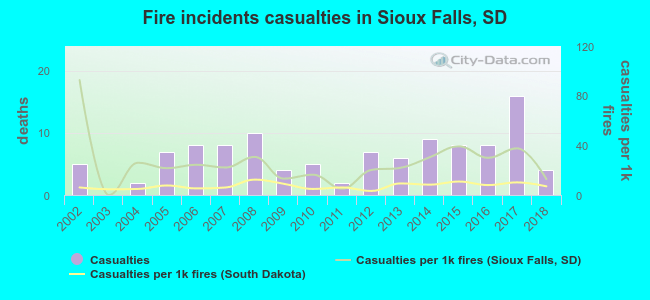 Based on the data from the years 2002 - 2018 the average number of fire-related yearly casualties is 6. The highest number of casualties - 16 took place in 2017, and the lowest - 0 in 2003. The data has a dropping trend.
The average number of injuries per 1,000 fire incidents is 26. This indicator was the highest - 93 in 2002, and the lowest 0 in 2003. The trend for injuries per 1,000 fire incidents is decreasing. Compared to the state value the number of injuries per 1,000 fire incidents is much higher.
Based on the data from the years 2002 - 2018 the average number of fire-related yearly casualties is 6. The highest number of casualties - 16 took place in 2017, and the lowest - 0 in 2003. The data has a dropping trend.
The average number of injuries per 1,000 fire incidents is 26. This indicator was the highest - 93 in 2002, and the lowest 0 in 2003. The trend for injuries per 1,000 fire incidents is decreasing. Compared to the state value the number of injuries per 1,000 fire incidents is much higher.Casualties per 1,000 incidents in Sioux Falls, SD compared to nearest cities:
(Note: Based on data for all years, including only cities with at least 500 fire incidents)
| Sioux Falls: | 23.6 |
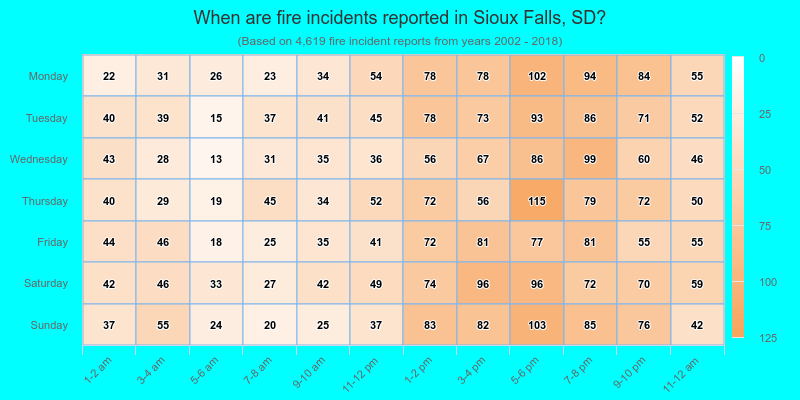
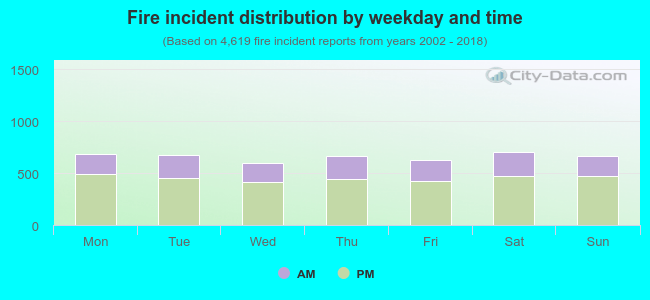 31.6% incidents where reported in the morning and 68.4% in the evening. The most fires (15.3%) took place on Saturday, and the least (13.0%) on Wednesday.
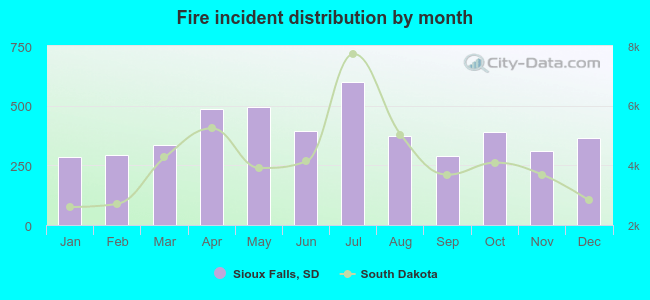 Based on the 4,619 fires from years 2002 - 2018 most fires (13.0%) took place during July, and the least (6.2%) in January.
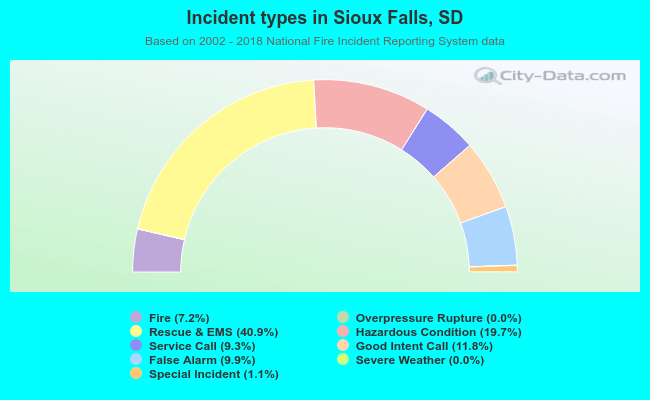 Out of all 64,113 cases reported during the years 2002 - 2018, the most belonged to the categories: Rescue & EMS (40.9%), Hazardous Condition (19.7%), and Good Intent Call (11.8%).
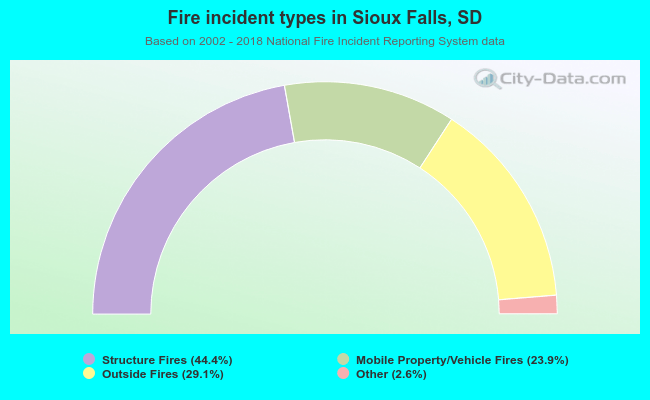 When looking into fire subcategories, the most incidents belonged to: Structure Fires (44.4%), and Outside Fires (29.1%).