Hartshorne: Fire Incidents, Oklahoma (OK)
Where are fire incidents reported in Hartshorne, OK
Something went wrong! Please refresh the page.
|
| |||||||||||||||||||||||||||||||||||||||||||||||||||||||||||||||||||||||||||||||||||||||||||||||||||||||||||||
2005 - 2017 National Fire Incident Reporting System (NFIRS) incidents
- Incident types reported to NFIRS in Hartshorne, OK
- 63378.1%Fire
- 779.5%Rescue & EMS
- 465.7%Good Intent Call
- 253.1%False Alarm
- 202.5%Hazardous Condition
- 81.0%Service Call
- 10.1%Special Incident
- Fire incident types reported to NFIRS in Hartshorne, OK
- 42567.1%Outside Fires
- 16826.5%Structure Fires
- 345.4%Mobile Property/Vehicle Fires
- 60.9%Other
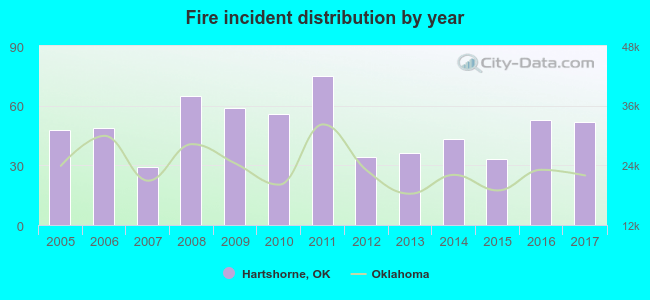 Based on the data from the years 2005 - 2017 the average number of fire incidents per year is 49. The highest number of fires - 75 took place in 2011, and the least - 29 in 2007. The data has a rising trend.
 The median response time based on all reported fire incidents is 6 minutes. This is similar to the Oklahoma median value.
The median response time in Hartshorne, OK compared to nearest cities:
(Note: Based on data for all years, including only cities with at least 500 fire incidents)
| Hartshorne: | 6 minutes |
| Krebs: | 5 minutes |
| McAlester: | 5 minutes |
| Talihina: | 12 minutes |
| Eufaula: | 9 minutes |
| Stigler: | 8 minutes |
| Antlers: | 8 minutes |
| Atoka: | 9 minutes |
| Henryetta: | 7 minutes |
 24.5% incidents where reported in the morning and 75.5% in the evening. The most fires (18.2%) took place on Saturday, and the least (11.2%) on Wednesday.
 Based on the 633 fire incident reports from years 2005 - 2017 most fires (14.1%) took place during March, and the least (4.3%) in May.
 Out of all 810 cases reported during the years 2005 - 2017, the most belonged to the categories: Fire (78.1%), Overpressure Rupture (9.5%), and Service Call (5.7%).
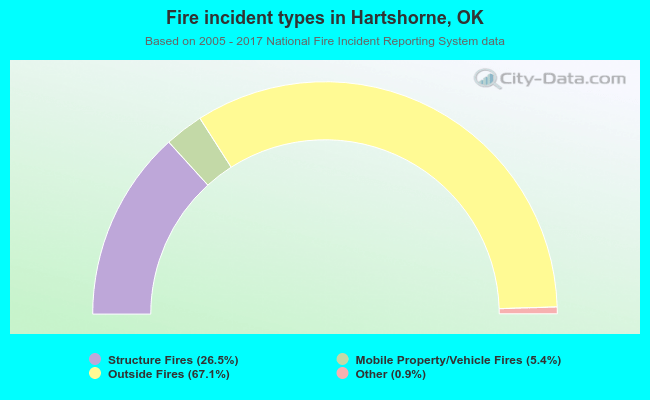 When looking into fire subcategories, the most reports belonged to: Outside Fires (67.1%), and Structure Fires (26.5%).