Henryetta: Fire Incidents, Oklahoma (OK)
Where are fire incidents reported in Henryetta, OK
Something went wrong! Please refresh the page.
|
| |||||||||||||||||||||||||||||||||||||||||||||||||||||||||||||||||||||||||||||||||||||||||||||||||||||||||||||
| Other | 598 | |||||||||||||||||||||||||||||||||||||||||||||||||||||||||||||||||||||||||||||||||||||||||||||||||||||||||||||
2005 - 2018 National Fire Incident Reporting System (NFIRS) incidents
- Incident types reported to NFIRS in Henryetta, OK
- 1,33827.3%Fire
- 1,33627.3%Good Intent Call
- 81316.6%Service Call
- 68814.0%Rescue & EMS
- 56111.5%Hazardous Condition
- 1402.9%False Alarm
- 140.3%Special Incident
- 90.2%Overpressure Rupture
- Fire incident types reported to NFIRS in Henryetta, OK
- 85664.0%Outside Fires
- 26820.0%Structure Fires
- 17613.2%Mobile Property/Vehicle Fires
- 382.8%Other
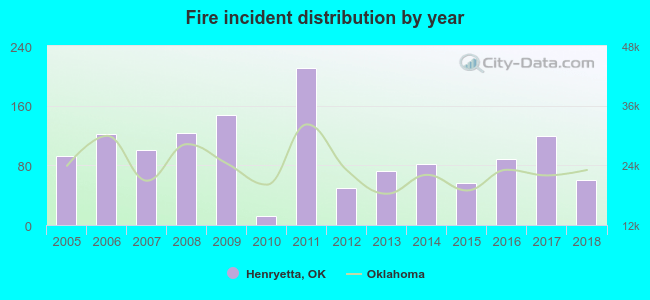 Based on the data from the years 2005 - 2018 the average number of fire incidents per year is 96. The highest number of fire incidents - 210 took place in 2011, and the least - 12 in 2010. The data has a dropping trend.
The average number of yearly fire incidents per 10k residents in Henryetta, OK compared to nearest cities:
(Note: Based on data for the last 3 years, including only cities with population 5,000 and above)
| Henryetta: | 155.7 |
| Okmulgee: | 60.8 |
| Holdenville: | 92.3 |
| Glenpool: | 49.5 |
| Bixby: | 20.1 |
| McAlester: | 152.4 |
| Jenks: | 35.9 |
| Sapulpa: | 90.7 |
| Coweta: | 31.5 |
 The median response time based on all reported fire incidents is 7 minutes. This is close to the state median value.
The median response time in Henryetta, OK compared to nearest cities:
(Note: Based on data for all years, including only cities with at least 500 fire incidents)
| Henryetta: | 7 minutes |
| Okmulgee: | 5 minutes |
| Morris: | 10 minutes |
| Beggs: | 10 minutes |
| Eufaula: | 9 minutes |
| Holdenville: | 5 minutes |
| Glenpool: | 4 minutes |
| Wewoka: | 7 minutes |
| Bristow: | 8 minutes |
 24.8% incidents where reported in the morning and 75.2% in the evening. The most fires (16.8%) took place on Sunday, and the least (11.9%) on Tuesday.
 Based on the 1,338 reports from years 2005 - 2018 most fires (18.5%) took place during March, and the least (4.0%) in June.
 Out of all 4,899 cases reported during the years 2005 - 2018, the most belonged to the categories: Fire (27.3%), Good Intent Call (27.3%), and Service Call (16.6%).
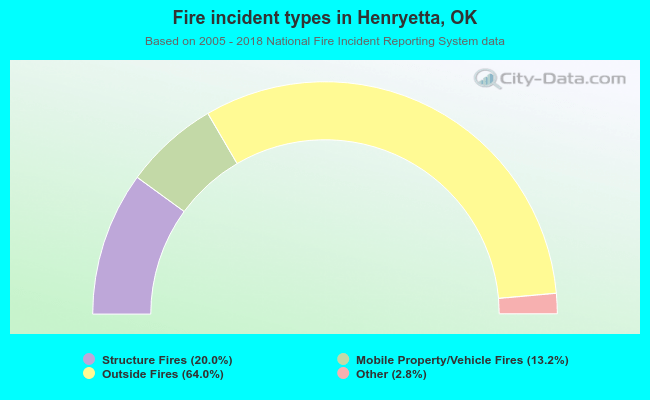 When looking into fire subcategories, the most incidents belonged to: Outside Fires (64.0%), and Structure Fires (20.0%).