Harvey: Fire Incidents, Illinois (IL)
Where are fire incidents reported in Harvey, IL
Something went wrong! Please refresh the page.
| Fire incidents reported | |
|---|---|
| Sreet name | Count |
| LEXINGTON AVE | 314 |
| HALSTED ST | 312 |
| LOOMIS AVE | 270 |
| CENTER AVE | 266 |
| DIXIE HWY | 200 |
| TURLINGTON AVE | 198 |
| 147 ST | 184 |
| MYRTLE AVE | 182 |
| WOOD ST | 152 |
| 154 ST | 140 |
| LEXINGTON | 126 |
| ASHLAND AVE | 124 |
| VINE AVE | 124 |
| 150 ST | 114 |
| UNION AVE | 114 |
| 155 ST | 112 |
| PAGE AVE | 112 |
| ROBEY AVE | 108 |
| PAULINA AVE | 104 |
| 148 ST | 102 |
| 159 ST | 102 |
| MARSHFIELD AVE | 98 |
| 151 ST | 96 |
| HONORE ST | 96 |
| LINCOLN AVE | 88 |
| CENTER | 84 |
| LATHROP AVE | 84 |
| WINCHESTER AVE | 84 |
| DESPLAINES ST | 82 |
| PARK AVE | 80 |
| Other | 401 |
2002 - 2018 National Fire Incident Reporting System (NFIRS) incidents
- Incident types reported to NFIRS in Harvey, IL
- 4,65338.8%Fire
- 2,75823.0%Hazardous Condition
- 2,08017.4%False Alarm
- 8907.4%Rescue & EMS
- 8497.1%Good Intent Call
- 7065.9%Service Call
- 290.2%Overpressure Rupture
- 140.1%Special Incident
- Fire incident types reported to NFIRS in Harvey, IL
- 2,84661.2%Structure Fires
- 98321.1%Outside Fires
- 63913.7%Mobile Property/Vehicle Fires
- 1854.0%Other
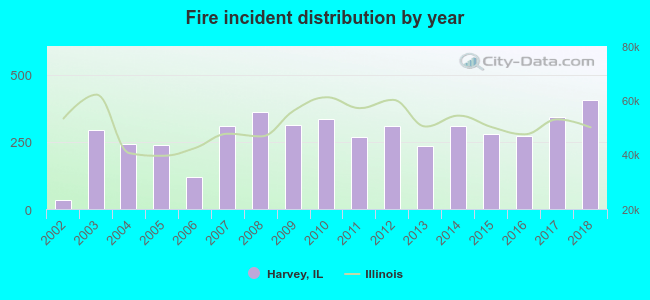 According to the data from the years 2002 - 2018 the average number of fire incidents per year is 274. The highest number of reported fires - 404 took place in 2018, and the least - 35 in 2002. The data has a rising trend.
The average number of yearly fire incidents per 10k residents in Harvey, IL compared to nearest cities:
(Note: Based on data for the last 3 years, including only cities with population 5,000 and above)
| Harvey: | 134.0 |
| Posen: | 48.7 |
| Markham: | 111.1 |
| Riverdale: | 97.3 |
| South Holland: | 57.7 |
| Dolton: | 97.7 |
| Hazel Crest: | 57.3 |
| Blue Island: | 60.4 |
| Robbins: | 109.5 |
 The median response time based on all reported fire incidents is 3 minutes. This is lower than the Illinois median value.
The median response time in Harvey, IL compared to nearest cities:
(Note: Based on data for all years, including only cities with at least 500 fire incidents)
| Harvey: | 3 minutes |
| Posen: | 4 minutes |
| Markham: | 5 minutes |
| Riverdale: | 5 minutes |
| South Holland: | 5 minutes |
| Dolton: | 5 minutes |
| Hazel Crest: | 5 minutes |
| Blue Island: | 5 minutes |
| Robbins: | 6 minutes |
 According to the data from the years 2002 - 2018 the average number of fire-related fatalities per year is 1. The highest number of reported deaths - 2 took place in 2003, and the lowest - 0 in 2002. The data has a constant trend.
The average number of deaths per 1,000 fire incidents is 3. This indicator was the highest - 8 in 2004, and the lowest 0 in 2002. The trend for deaths per 1,000 incidents is constant. Compared to the Illinois value the number of deaths per 1,000 fire incidents is higher.
According to the data from the years 2002 - 2018 the average number of fire-related fatalities per year is 1. The highest number of reported deaths - 2 took place in 2003, and the lowest - 0 in 2002. The data has a constant trend.
The average number of deaths per 1,000 fire incidents is 3. This indicator was the highest - 8 in 2004, and the lowest 0 in 2002. The trend for deaths per 1,000 incidents is constant. Compared to the Illinois value the number of deaths per 1,000 fire incidents is higher.Deaths per 1,000 incidents in Harvey, IL compared to nearest cities:
(Note: Based on data for all years, including only cities with at least 2,500 fire incidents)
| Harvey: | 2.8 |
| Riverdale: | 1.2 |
| Dolton: | 0.6 |
| Calumet City: | 2.5 |
| Oak Lawn: | 3.9 |
| Chicago: | 2.0 |
 According to the data from the years 2002 - 2018 the average number of fire-related yearly casualties is 3. The highest number of injuries - 11 took place in 2003, and the lowest - 0 in 2002. The data has a growing trend.
The average number of casualties per 1,000 fires is 10. This indicator was the highest - 45 in 2004, and the lowest 0 in 2002. The trend for injuries per 1,000 fires is growing. Compared to the Illinois value the number of injuries per 1,000 fires is similar.
According to the data from the years 2002 - 2018 the average number of fire-related yearly casualties is 3. The highest number of injuries - 11 took place in 2003, and the lowest - 0 in 2002. The data has a growing trend.
The average number of casualties per 1,000 fires is 10. This indicator was the highest - 45 in 2004, and the lowest 0 in 2002. The trend for injuries per 1,000 fires is growing. Compared to the Illinois value the number of injuries per 1,000 fires is similar.Casualties per 1,000 incidents in Harvey, IL compared to nearest cities:
(Note: Based on data for all years, including only cities with at least 500 fire incidents)
| Harvey: | 10.1 |
| Posen: | 1.5 |
| Markham: | 0.0 |
| Riverdale: | 8.6 |
| South Holland: | 22.0 |
| Dolton: | 8.3 |
| Hazel Crest: | 11.5 |
| Blue Island: | 13.3 |
| Robbins: | 5.1 |
 41.6% incidents where reported in the morning and 58.4% in the evening. The most fires (15.6%) took place on Thursday, and the least (13.6%) on Wednesday.
 Based on the 4,653 reports from years 2002 - 2018 most fires (13.2%) took place during July, and the least (5.3%) in February.
 Out of all 11,987 cases reported during the years 2002 - 2018, the most belonged to the categories: Fire (38.8%), Hazardous Condition (23.0%), and False Alarm (17.4%).
 When looking into fire subcategories, the most incidents belonged to: Structure Fires (61.2%), and Outside Fires (21.1%).