Riverdale: Fire Incidents, Illinois (IL)
Where are fire incidents reported in Riverdale, IL
Something went wrong! Please refresh the page.
| Fire incidents reported | |
|---|---|
| Sreet name | Count |
| TRACY AVE | 260 |
| 138TH ST | 256 |
| STEWART AVE | 216 |
| SCHOOL ST | 206 |
| ATLANTIC AVE | 194 |
| 144TH ST | 186 |
| INDIANA AVE | 180 |
| HALSTED ST | 162 |
| STATE ST | 122 |
| MICHIGAN AVE | 114 |
| 137TH ST | 112 |
| CLARK ST | 102 |
| 137TH PL | 98 |
| DEARBORN ST | 96 |
| PARNELL AVE | 88 |
| LOWE AVE | 86 |
| WABASH AVE | 86 |
| WENTWORTH AVE | 84 |
| NORMAL AVE | 80 |
| EDBROOKE AVE | 78 |
| 140TH CT | 76 |
| ASHLAND AVE | 70 |
| ATLANTIC | 66 |
| UNION AVE | 64 |
| PERRY AVE | 62 |
| LA SALLE ST | 56 |
| WALLACE AVE | 56 |
| TRACY | 52 |
| 134TH ST | 50 |
| 136TH ST | 50 |
2002 - 2018 National Fire Incident Reporting System (NFIRS) incidents
- Incident types reported to NFIRS in Riverdale, IL
- 10,90759.6%Rescue & EMS
- 2,56014.0%Fire
- 2,06911.3%Hazardous Condition
- 1,3237.2%False Alarm
- 8254.5%Good Intent Call
- 5673.1%Service Call
- 230.1%Special Incident
- Fire incident types reported to NFIRS in Riverdale, IL
- 1,63663.9%Structure Fires
- 55721.8%Outside Fires
- 32212.6%Mobile Property/Vehicle Fires
- 451.8%Other
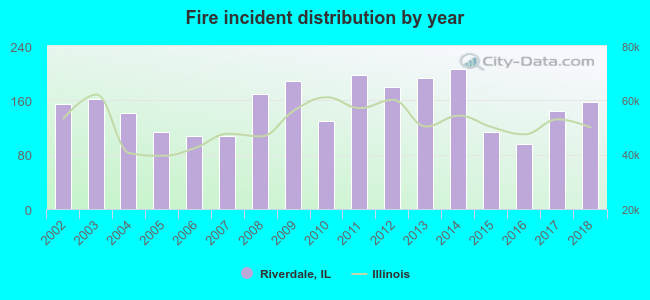 Based on the data from the years 2002 - 2018 the average number of fires per year is 151. The highest number of reported fire incidents - 206 took place in 2014, and the least - 95 in 2016. The data has a growing trend.
The average number of yearly fire incidents per 10k residents in Riverdale, IL compared to nearest cities:
(Note: Based on data for the last 3 years, including only cities with population 5,000 and above)
| Riverdale: | 97.3 |
| Dolton: | 97.7 |
| Calumet Park: | 124.0 |
| Harvey: | 134.0 |
| Blue Island: | 60.4 |
| Posen: | 48.7 |
| South Holland: | 57.7 |
| Robbins: | 109.5 |
| Markham: | 111.1 |
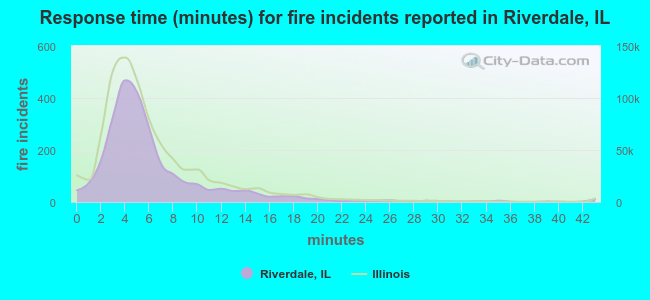 The median response time based on all reported fire incidents is 5 minutes. This is close to the state median value.
The median response time in Riverdale, IL compared to nearest cities:
(Note: Based on data for all years, including only cities with at least 500 fire incidents)
| Riverdale: | 5 minutes |
| Dolton: | 5 minutes |
| Calumet Park: | 5 minutes |
| Harvey: | 3 minutes |
| Blue Island: | 5 minutes |
| Posen: | 4 minutes |
| South Holland: | 5 minutes |
| Robbins: | 6 minutes |
| Burnham: | 7 minutes |
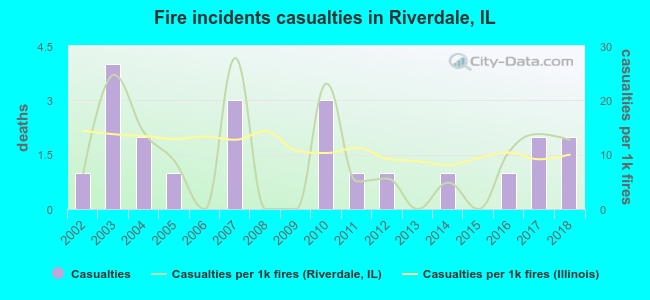 According to the reports from the years 2002 - 2018 the average number of fire-related yearly casualties is 1. The highest number of injuries - 4 took place in 2003, and the lowest - 0 in 2006. The data has a rising trend.
The average number of casualties per 1,000 fire incidents is 9. This indicator was the highest - 28 in 2007, and the lowest 0 in 2006. The trend for injuries per 1,000 fires is growing. Compared to the state value the number of injuries per 1,000 fire incidents is lower.
According to the reports from the years 2002 - 2018 the average number of fire-related yearly casualties is 1. The highest number of injuries - 4 took place in 2003, and the lowest - 0 in 2006. The data has a rising trend.
The average number of casualties per 1,000 fire incidents is 9. This indicator was the highest - 28 in 2007, and the lowest 0 in 2006. The trend for injuries per 1,000 fires is growing. Compared to the state value the number of injuries per 1,000 fire incidents is lower.Casualties per 1,000 incidents in Riverdale, IL compared to nearest cities:
(Note: Based on data for all years, including only cities with at least 500 fire incidents)
| Riverdale: | 8.6 |
| Dolton: | 8.3 |
| Calumet Park: | 1.0 |
| Harvey: | 10.1 |
| Blue Island: | 13.3 |
| Posen: | 1.5 |
| South Holland: | 22.0 |
| Robbins: | 5.1 |
| Burnham: | 5.9 |
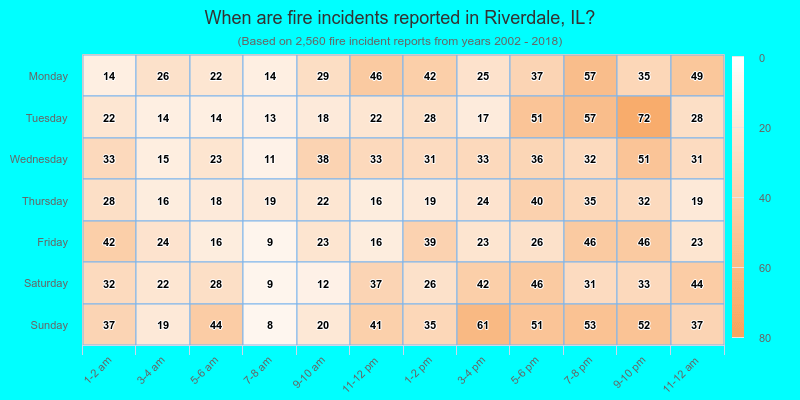
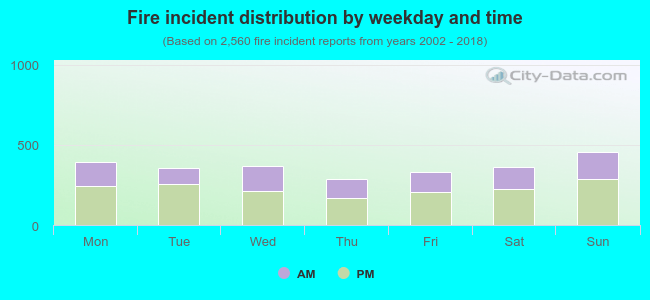 37.7% incidents where reported in the morning and 62.3% in the evening. The most fires (17.9%) took place on Sunday, and the least (11.3%) on Thursday.
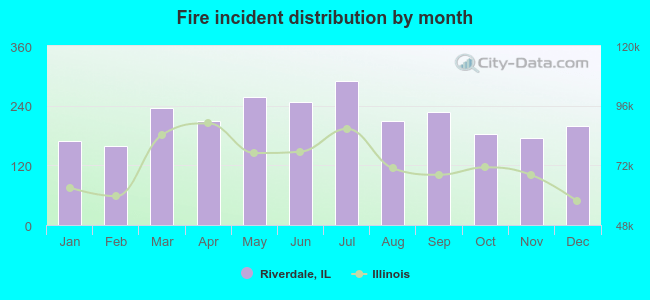 According to the 2,560 fire incident reports from years 2002 - 2018 most fires (11.3%) took place during July, and the least (6.2%) in February.
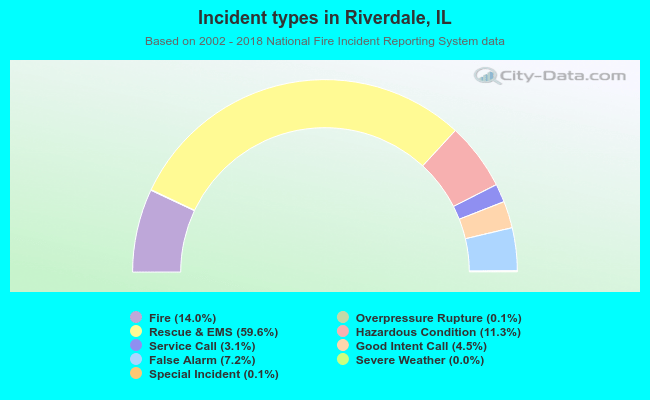 Out of all 18,296 cases reported during the years 2002 - 2018, the most belonged to the categories: Rescue & EMS (59.6%), Fire (14.0%), and Hazardous Condition (11.3%).
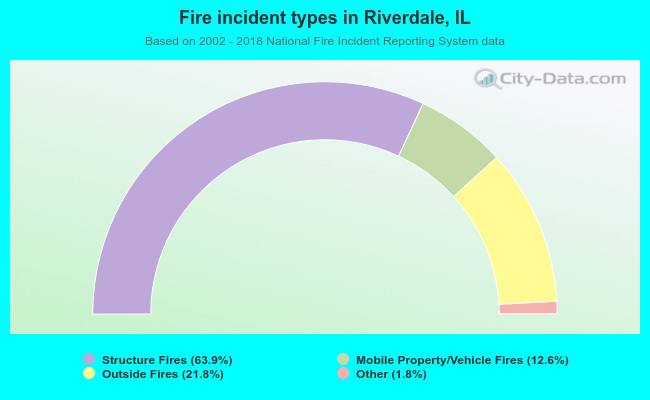 When looking into fire subcategories, the most incidents belonged to: Structure Fires (63.9%), and Outside Fires (21.8%).