Harwinton: Fire Incidents, Connecticut (CT)
Where are fire incidents reported in Harwinton, CT
Something went wrong! Please refresh the page.
|
| |||||||||||||||||||||||||||||||||||||||||||||||||||||||||||||||||||||||||||||||||||||||||||||||||||||||||||||
2002 - 2018 National Fire Incident Reporting System (NFIRS) incidents
- Incident types reported to NFIRS in Harwinton, CT
- 89433.2%Hazardous Condition
- 53920.0%Fire
- 40815.1%Rescue & EMS
- 37513.9%Good Intent Call
- 30111.2%False Alarm
- 1475.5%Service Call
- 210.8%Special Incident
- 60.2%Overpressure Rupture
- 30.1%Severe Weather
- Fire incident types reported to NFIRS in Harwinton, CT
- 23844.2%Structure Fires
- 19736.5%Outside Fires
- 8014.8%Mobile Property/Vehicle Fires
- 244.5%Other
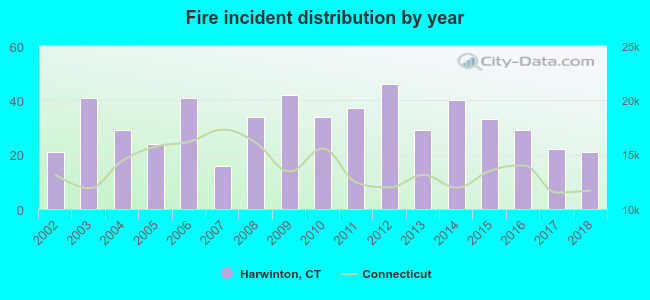 Based on the data from the years 2002 - 2018 the average number of fires per year is 32. The highest number of fires - 46 took place in 2012, and the least - 16 in 2007. The data has a constant trend.
The average number of yearly fire incidents per 10k residents in Harwinton, CT compared to nearest cities:
(Note: Based on data for the last 3 years, including only cities with population 5,000 and above)
| Harwinton: | 42.5 |
| Torrington: | 26.8 |
| Burlington: | 28.7 |
| Thomaston: | 23.2 |
| Terryville: | 26.0 |
| Plymouth: | 3.7 |
| New Hartford: | 41.6 |
| Bristol: | 35.6 |
| Canton: | 38.2 |
 The median response time based on all reported fire incidents is 7 minutes. This is higher than the state median value.
The median response time in Harwinton, CT compared to nearest cities:
(Note: Based on data for all years, including only cities with at least 500 fire incidents)
| Harwinton: | 7 minutes |
| Torrington: | 5 minutes |
| Bristol: | 4 minutes |
| Avon: | 7 minutes |
| Winsted: | 6 minutes |
| Watertown: | 3 minutes |
| Farmington: | 7 minutes |
| Plainville: | 5 minutes |
| Wolcott: | 5 minutes |
 30.2% incidents where reported in the morning and 69.8% in the evening. The most fires (16.5%) took place on Saturday, and the least (11.9%) on Monday.
 According to the 539 fires from years 2002 - 2018 most fires (17.4%) took place during April, and the least (4.6%) in September.
 Out of all 2,694 cases reported during the years 2002 - 2018, the most belonged to the categories: Hazardous Condition (33.2%), Fire (20.0%), and Rescue & EMS (15.1%).
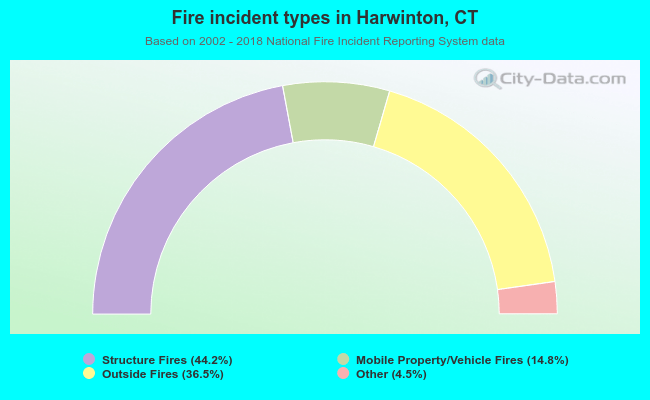 When looking into fire subcategories, the most reports belonged to: Structure Fires (44.2%), and Outside Fires (36.5%).