Terryville: Fire Incidents, Connecticut (CT)
Where are fire incidents reported in Terryville, CT
Something went wrong! Please refresh the page.
|
| |||||||||||||||||||||||||||||||||||||||||||||||||||||||||||||||||||||||||||||||||||||||||||||||||||||||||||||
2002 - 2018 National Fire Incident Reporting System (NFIRS) incidents
- Incident types reported to NFIRS in Terryville, CT
- 1,03044.4%Hazardous Condition
- 46119.9%Fire
- 43418.7%Service Call
- 2089.0%False Alarm
- 1556.7%Good Intent Call
- 241.0%Rescue & EMS
- 80.3%Overpressure Rupture
- Fire incident types reported to NFIRS in Terryville, CT
- 23150.1%Structure Fires
- 13228.6%Outside Fires
- 7416.1%Mobile Property/Vehicle Fires
- 245.2%Other
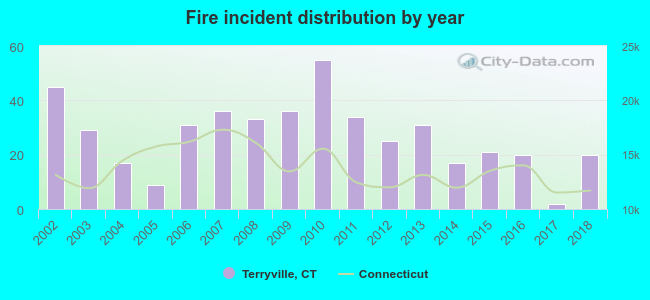 Based on the data from the years 2002 - 2018 the average number of fires per year is 27. The highest number of reported fires - 55 took place in 2010, and the least - 2 in 2017. The data has a decreasing trend.
The average number of yearly fire incidents per 10k residents in Terryville, CT compared to nearest cities:
(Note: Based on data for the last 3 years, including only cities with population 5,000 and above)
| Terryville: | 26.0 |
| Plymouth: | 3.7 |
| Bristol: | 35.6 |
| Thomaston: | 23.2 |
| Wolcott: | 22.2 |
| Burlington: | 28.7 |
| Harwinton: | 42.5 |
| Plainville: | 43.1 |
| Oakville: | 21.0 |

 According to the reports from the years 2002 - 2018 the average number of fire-related casualties per year is 0. The highest number of casualties - 3 took place in 2009, and the lowest - 0 in 2002. The data has a constant trend.
 28.2% incidents where reported in the morning and 71.8% in the evening. The most fires (16.9%) took place on Wednesday, and the least (12.6%) on Saturday.
 Based on the 461 incident reports from years 2002 - 2018 most fires (10.6%) took place during April, and the least (6.3%) in December.
 Out of all 2,321 cases reported during the years 2002 - 2018, the most belonged to the categories: Hazardous Condition (44.4%), Fire (19.9%), and Service Call (18.7%).
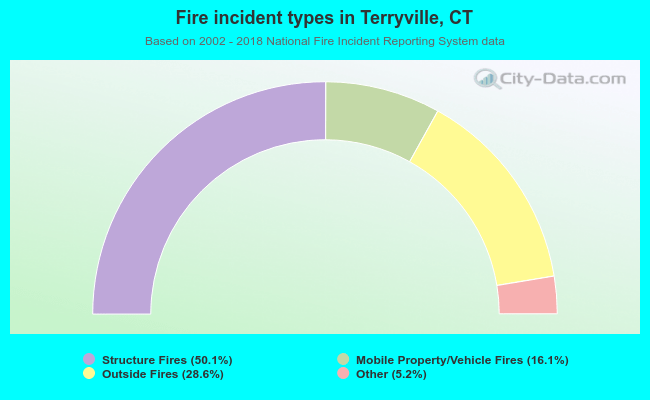 When looking into fire subcategories, the most incidents belonged to: Structure Fires (50.1%), and Outside Fires (28.6%).