Hastings: Fire Incidents, New York (NY)
Where are fire incidents reported in Hastings, NY
Something went wrong! Please refresh the page.
|
| |||||||||||||||||||||||||||||||||||||||||||||||||||||||||||||||||||||||||||||||||||||||||||||||||||||||||||||
2003 - 2018 National Fire Incident Reporting System (NFIRS) incidents
- Incident types reported to NFIRS in Hastings, NY
- 56649.3%Rescue & EMS
- 15113.2%Fire
- 14812.9%Good Intent Call
- 1139.8%Hazardous Condition
- 958.3%Service Call
- 746.4%False Alarm
- Fire incident types reported to NFIRS in Hastings, NY
- 11676.8%Structure Fires
- 2113.9%Outside Fires
- 96.0%Mobile Property/Vehicle Fires
- 53.3%Other
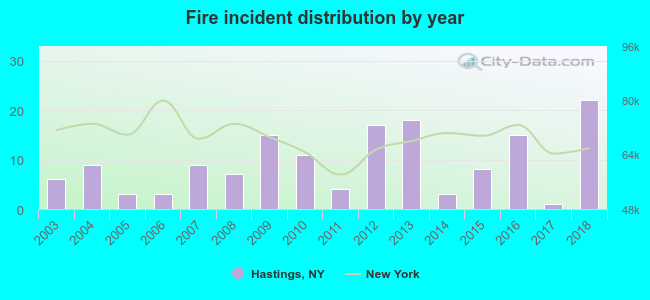 Based on the data from the years 2003 - 2018 the average number of fire incidents per year is 9. The highest number of fire incidents - 22 took place in 2018, and the least - 1 in 2017. The data has a rising trend.
The average number of yearly fire incidents per 10k residents in Hastings, NY compared to nearest cities:
(Note: Based on data for the last 3 years, including only cities with population 5,000 and above)
| Hastings: | 13.4 |
| Cicero: | 24.4 |
| Clay: | 6.6 |
| North Syracuse: | 96.9 |
| Volney: | 6.7 |
| Fulton: | 92.4 |
| Baldwinsville: | 90.7 |
| Lysander: | 1.4 |
| Mattydale: | 63.1 |
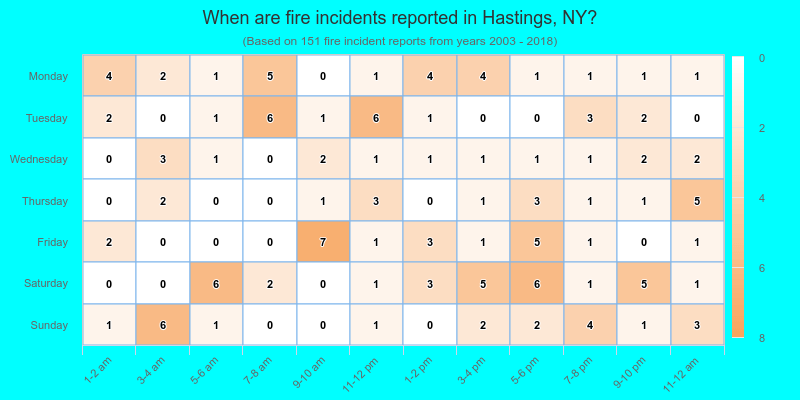
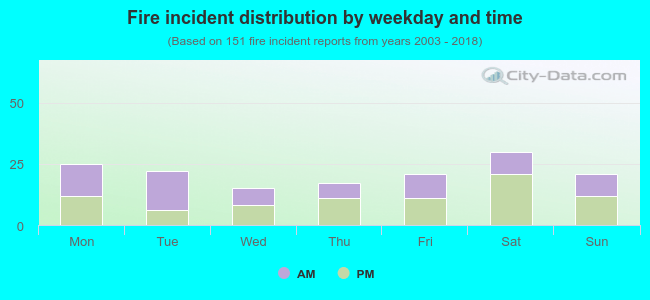 46.4% incidents where reported in the morning and 53.6% in the evening. The most fires (19.9%) took place on Saturday, and the least (9.9%) on Wednesday.
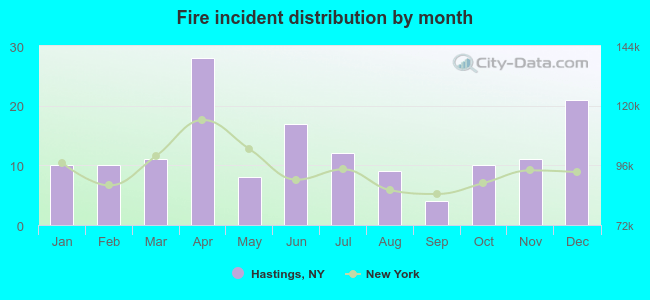 According to the 151 incident reports from years 2003 - 2018 most fires (18.5%) took place during April, and the least (2.6%) in September.
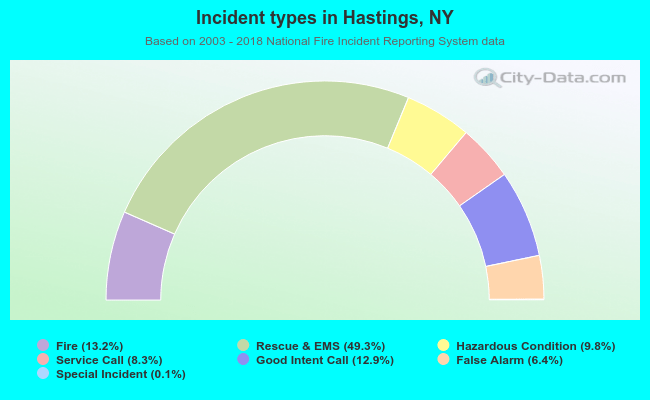 Out of all 1,148 cases reported during the years 2003 - 2018, the most belonged to the categories: Overpressure Rupture (49.3%), Fire (13.2%), and Service Call (12.9%).
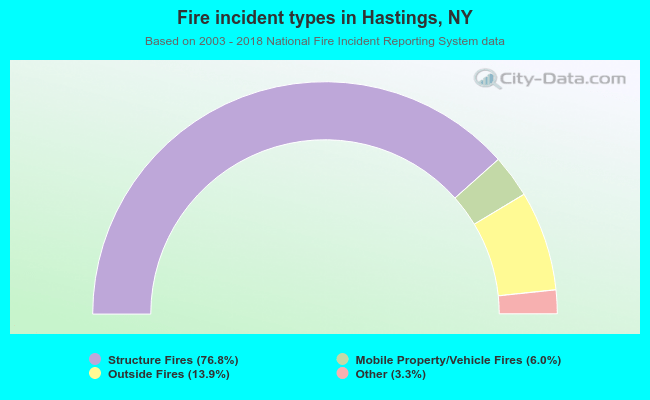 When looking into fire subcategories, the most reports belonged to: Structure Fires (76.8%), and Outside Fires (13.9%).