Cicero: Fire Incidents, New York (NY)
Where are fire incidents reported in Cicero, NY
Something went wrong! Please refresh the page.
| Fire incidents reported | |
|---|---|
| Sreet name | Count |
| BREWERTON RD | 124 |
| ROUTE 31 | 118 |
| LAKESHORE RD | 70 |
| BREWERTON RD | 56 |
| LAKESHORE RD | 46 |
| LAKESHORE RD | 38 |
| ROUTE 31 RT | 30 |
| BREWERTON ROAD | 28 |
| RT. 31 | 28 |
| ISLAND RD | 26 |
| ISLAND RD | 24 |
| SOUTH BAY RD | 22 |
| RT 31 | 20 |
| LOMBARDI DR | 18 |
| MCKINLEY RD | 18 |
| SB I 81 | 18 |
| THOMPSON RD | 18 |
| E TAFT RD | 16 |
| SOUTH BAY RD | 16 |
| STATE ROUTE 31 | 16 |
| THOMPSON RD | 16 |
| COBBLESTONE DR | 14 |
| GLENDORA RD | 14 |
| ISLAND ROAD | 14 |
| MUD MILL RD | 14 |
| MUD MILL RD. | 14 |
| PARDEE RD | 14 |
| BEACH RD. | 12 |
| CARMENICA DR | 12 |
| LESLIEANNE PATH | 12 |
| Other | 254 |
2003 - 2018 National Fire Incident Reporting System (NFIRS) incidents
- Incident types reported to NFIRS in Cicero, NY
- 3,20838.6%Rescue & EMS
- 1,40216.9%Hazardous Condition
- 1,32916.0%Good Intent Call
- 1,14013.7%Fire
- 7338.8%False Alarm
- 4655.6%Service Call
- 140.2%Overpressure Rupture
- 130.2%Special Incident
- Fire incident types reported to NFIRS in Cicero, NY
- 58351.1%Structure Fires
- 25822.6%Outside Fires
- 16814.7%Other
- 13111.5%Mobile Property/Vehicle Fires
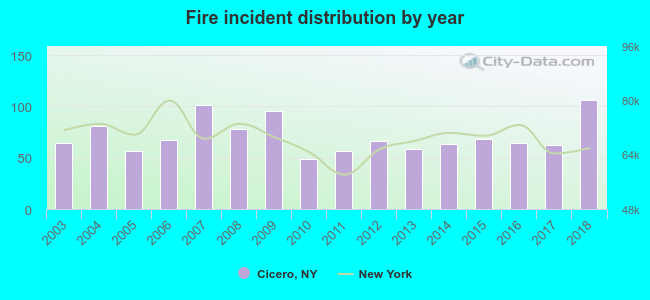 Based on the data from the years 2003 - 2018 the average number of fires per year is 71. The highest number of reported fires - 106 took place in 2018, and the least - 49 in 2010. The data has a rising trend.
The average number of yearly fire incidents per 10k residents in Cicero, NY compared to nearest cities:
(Note: Based on data for the last 3 years, including only cities with population 5,000 and above)
| Cicero: | 24.4 |
| North Syracuse: | 96.9 |
| Clay: | 6.6 |
| Mattydale: | 63.1 |
| De Witt: | 14.3 |
| Syracuse: | 77.4 |
| Hastings: | 13.4 |
| Solvay: | 38.7 |
| Fairmount: | 1.0 |
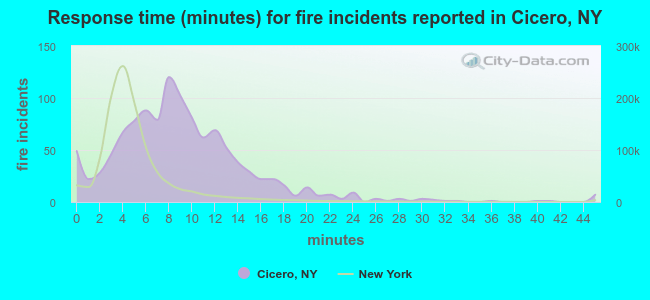 The median response time based on all reported fire incidents is 8 minutes. This is higher than the state median value.
The median response time in Cicero, NY compared to nearest cities:
(Note: Based on data for all years, including only cities with at least 500 fire incidents)
| Cicero: | 8 minutes |
| North Syracuse: | 7 minutes |
| Clay: | 8 minutes |
| Mattydale: | 5 minutes |
| Liverpool: | 7 minutes |
| East Syracuse: | 5 minutes |
| Central Square: | 10 minutes |
| Syracuse: | 3 minutes |
| Fayetteville: | 5 minutes |
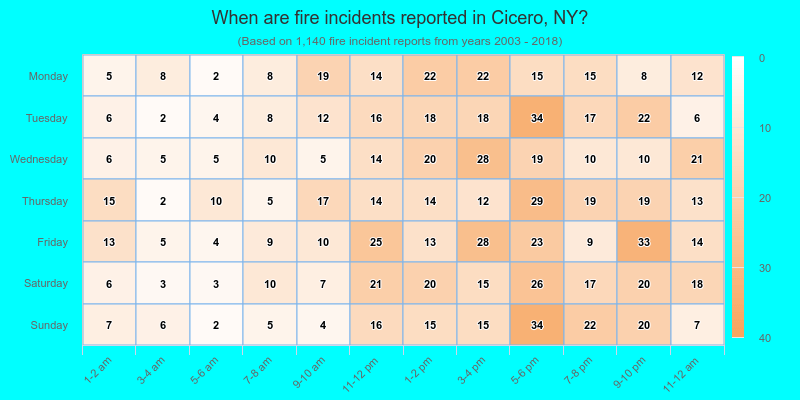
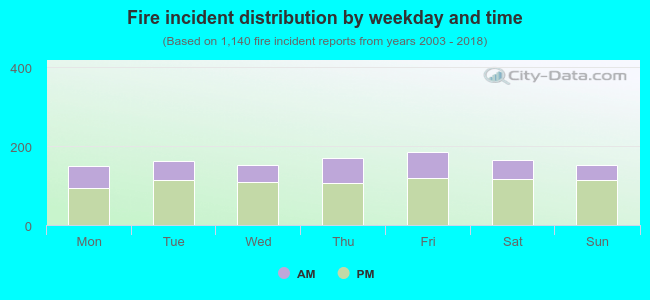 32.3% incidents where reported in the morning and 67.7% in the evening. The most fires (16.3%) took place on Friday, and the least (13.2%) on Monday.
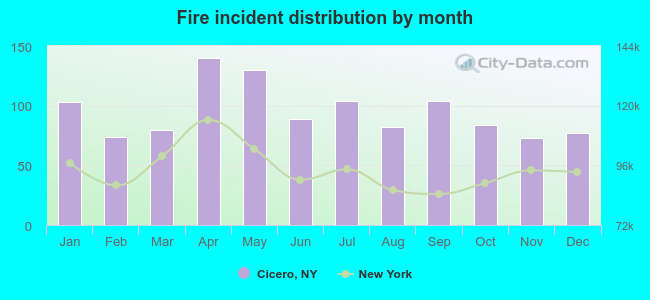 Based on the 1,140 fire incident reports from years 2003 - 2018 most fires (12.3%) took place during April, and the least (6.4%) in November.
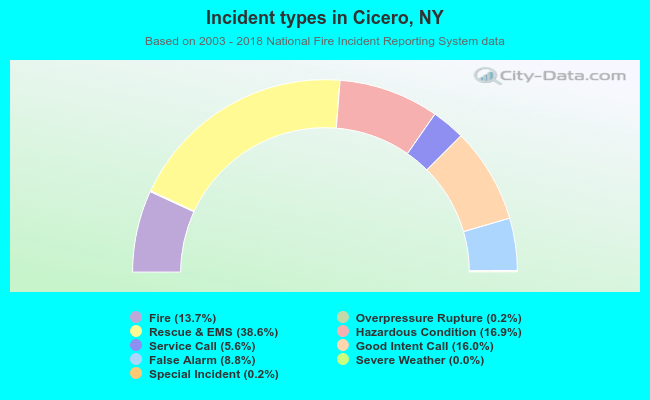 Out of all 8,307 cases reported during the years 2003 - 2018, the most belonged to the categories: Rescue & EMS (38.6%), Hazardous Condition (16.9%), and Good Intent Call (16.0%).
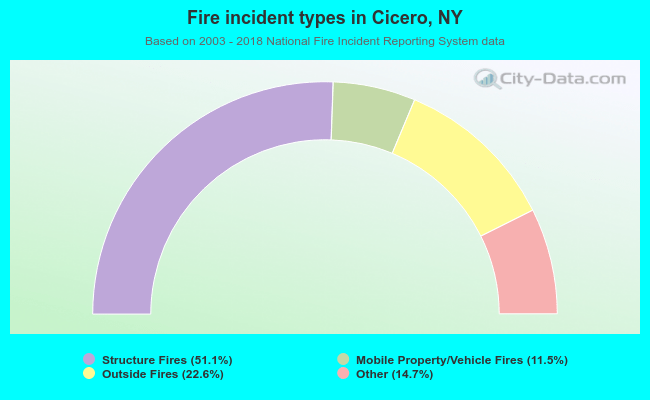 When looking into fire subcategories, the most incidents belonged to: Structure Fires (51.1%), and Outside Fires (22.6%).