Hearne: Fire Incidents, Texas (TX)
Where are fire incidents reported in Hearne, TX
Something went wrong! Please refresh the page.
|
| |||||||||||||||||||||||||||||||||||||||||||||||||||||||||||||||||||||||||||||||||||||||||||||||||||||||||||||
| Other | 344 | |||||||||||||||||||||||||||||||||||||||||||||||||||||||||||||||||||||||||||||||||||||||||||||||||||||||||||||
2002 - 2018 National Fire Incident Reporting System (NFIRS) incidents
- Incident types reported to NFIRS in Hearne, TX
- 99460.1%Fire
- 33020.0%Hazardous Condition
- 17410.5%Rescue & EMS
- 1146.9%Good Intent Call
- 291.8%Service Call
- 60.4%False Alarm
- 40.2%Overpressure Rupture
- 20.1%Severe Weather
- Fire incident types reported to NFIRS in Hearne, TX
- 57758.0%Other
- 29329.5%Outside Fires
- 777.7%Structure Fires
- 474.7%Mobile Property/Vehicle Fires
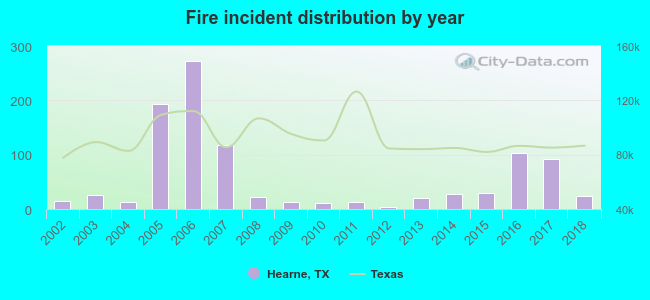 According to the data from the years 2002 - 2018 the average number of fires per year is 58. The highest number of fire incidents - 272 took place in 2006, and the least - 4 in 2012. The data has an increasing trend.
 The median response time based on all reported fire incidents is 4 minutes. This is lower compared to the Texas median value.
The median response time in Hearne, TX compared to nearest cities:
(Note: Based on data for all years, including only cities with at least 500 fire incidents)
| Hearne: | 4 minutes |
| Bryan: | 6 minutes |
| Bremond: | 10 minutes |
| Cameron: | 5 minutes |
| Caldwell: | 12 minutes |
| College Station: | 6 minutes |
| Rockdale: | 9 minutes |
| Marlin: | 3 minutes |
| Groesbeck: | 12 minutes |
 24.3% incidents where reported in the morning and 75.7% in the evening. The most fires (17.1%) took place on Saturday, and the least (10.8%) on Wednesday.
 According to the 994 incident reports from years 2002 - 2018 most fires (11.6%) took place during July, and the least (4.8%) in May.
 Out of all 1,654 cases reported during the years 2002 - 2018, the most belonged to the categories: Fire (60.1%), Hazardous Condition (20.0%), and Rescue & EMS (10.5%).
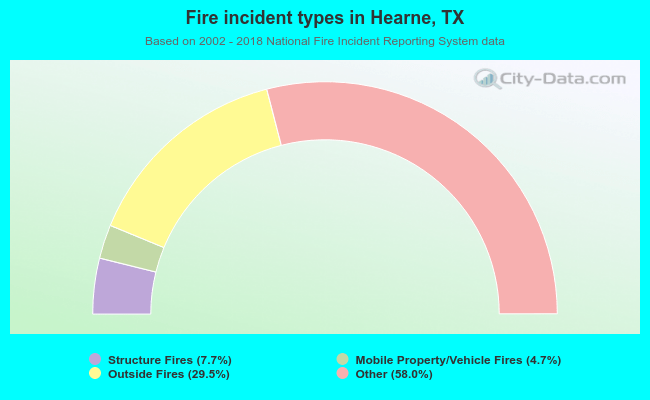 When looking into fire subcategories, the most incidents belonged to: Other (58.0%), and Outside Fires (29.5%).