Bryan: Fire Incidents, Texas (TX)
Where are fire incidents reported in Bryan, TX
Something went wrong! Please refresh the page.
| Fire incidents reported | |
|---|---|
| Sreet name | Count |
| SH 21 | 268 |
| 29TH ST | 256 |
| VILLA MARIA RD | 236 |
| EARL RUDDER FW | 206 |
| TEXAS AV | 200 |
| TEXAS AVE | 178 |
| FINFEATHER RD | 156 |
| BRIARCREST DR | 138 |
| WELLBORN RD | 134 |
| SANDY POINT RD | 118 |
| 28TH ST | 114 |
| HARVEY MITCHELL PW | 106 |
| STATE HIGHWAY 21 | 86 |
| CLEAR LEAF DR | 82 |
| MLK ST | 82 |
| OSR | 82 |
| HARVEY MITCHELL | 74 |
| SH 21 HWY | 70 |
| COLLEGE MAIN ST | 68 |
| LEONARD RD | 68 |
| OLD HEARNE RD | 64 |
| WJB PW | 60 |
| 26TH ST | 58 |
| MAIN ST | 58 |
| EARL RUDDER FRONTA RD | 54 |
| COLLEGE AV | 52 |
| EARL RUDDER FWY | 52 |
| FM 1179 RD | 52 |
| HARVEY MITCHELL PKY | 50 |
| SAN JACINTO LN | 50 |
| Other | 2,257 |
2002 - 2018 National Fire Incident Reporting System (NFIRS) incidents
- Incident types reported to NFIRS in Bryan, TX
- 46,11867.5%Rescue & EMS
- 5,8488.6%Good Intent Call
- 5,5298.1%Fire
- 4,9077.2%Hazardous Condition
- 3,9175.7%Service Call
- 1,8842.8%False Alarm
- 730.1%Special Incident
- Fire incident types reported to NFIRS in Bryan, TX
- 2,46844.6%Outside Fires
- 2,02136.6%Structure Fires
- 91616.6%Mobile Property/Vehicle Fires
- 1242.2%Other
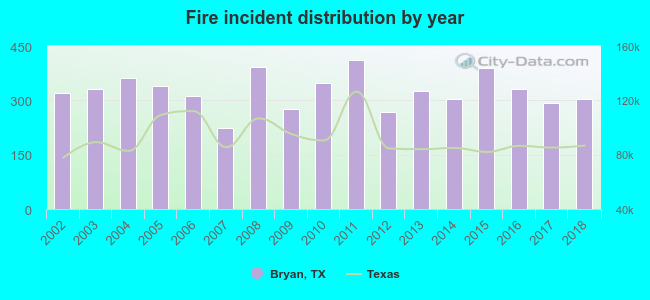 According to the data from the years 2002 - 2018 the average number of fire incidents per year is 325. The highest number of reported fires - 412 took place in 2011, and the least - 223 in 2007. The data has a decreasing trend.
The average number of yearly fire incidents per 10k residents in Bryan, TX compared to nearest cities:
(Note: Based on data for the last 3 years, including only cities with population 5,000 and above)
| Bryan: | 38.2 |
| College Station: | 25.1 |
| Navasota: | 165.5 |
| Brenham: | 36.6 |
| Rockdale: | 49.8 |
| Cameron: | 87.7 |
| Hempstead: | 15.4 |
| Prairie View: | 22.1 |
| Giddings: | 130.9 |
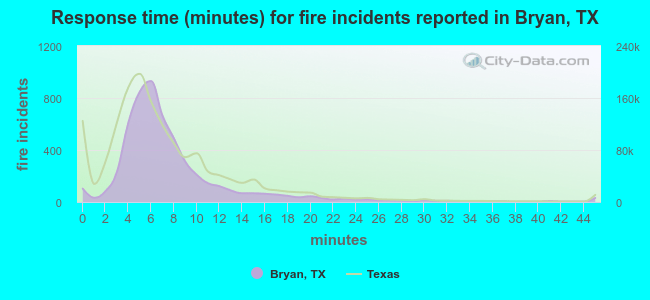 The median response time based on all reported fire incidents is 6 minutes. This is about the same as the state median value.
The median response time in Bryan, TX compared to nearest cities:
(Note: Based on data for all years, including only cities with at least 500 fire incidents)
| Bryan: | 6 minutes |
| College Station: | 6 minutes |
| Hearne: | 4 minutes |
| Caldwell: | 12 minutes |
| Navasota: | 7 minutes |
| Brenham: | 5 minutes |
| Rockdale: | 9 minutes |
| Cameron: | 5 minutes |
| Bremond: | 10 minutes |
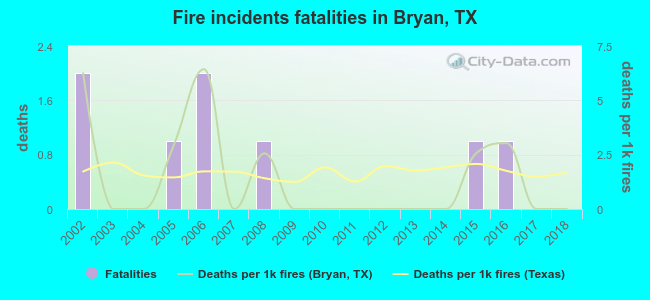 Based on the data from the years 2002 - 2018 the average number of fire-related yearly deaths is 0. The highest number of deaths - 2 took place in 2002, and the lowest - 0 in 2003. The data has a decreasing trend.
The average number of deaths per 1,000 fires is 1. This indicator was the highest - 6 in 2006, and the lowest 0 in 2003. The trend for fatalities per 1,000 incidents is dropping. Compared to the Texas value the number of fatalities per 1,000 fire incidents is similar.
Based on the data from the years 2002 - 2018 the average number of fire-related yearly deaths is 0. The highest number of deaths - 2 took place in 2002, and the lowest - 0 in 2003. The data has a decreasing trend.
The average number of deaths per 1,000 fires is 1. This indicator was the highest - 6 in 2006, and the lowest 0 in 2003. The trend for fatalities per 1,000 incidents is dropping. Compared to the Texas value the number of fatalities per 1,000 fire incidents is similar.Deaths per 1,000 incidents in Bryan, TX compared to nearest cities:
(Note: Based on data for all years, including only cities with at least 2,500 fire incidents)
| Bryan: | 1.4 |
| College Station: | 1.7 |
| Montgomery: | 1.5 |
| Magnolia: | 1.4 |
| Huntsville: | 0.8 |
| Willis: | 1.6 |
| Conroe: | 2.9 |
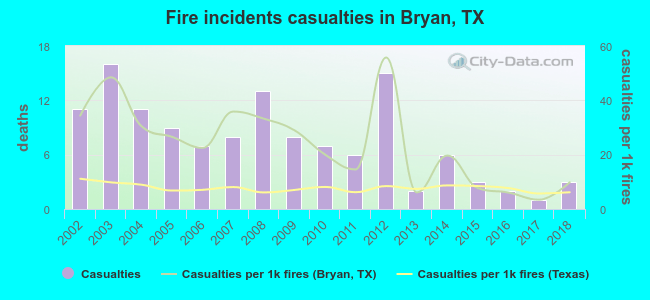 Based on the data from the years 2002 - 2018 the average number of fire-related yearly casualties is 8. The highest number of casualties - 16 took place in 2003, and the lowest - 1 in 2017. The data has a declining trend.
The average number of casualties per 1,000 fires is 24. This indicator was the highest - 56 in 2012, and the lowest 3 in 2017. The trend for casualties per 1,000 fire incidents is dropping. Compared to the Texas value the number of injuries per 1,000 fire incidents is much higher.
Based on the data from the years 2002 - 2018 the average number of fire-related yearly casualties is 8. The highest number of casualties - 16 took place in 2003, and the lowest - 1 in 2017. The data has a declining trend.
The average number of casualties per 1,000 fires is 24. This indicator was the highest - 56 in 2012, and the lowest 3 in 2017. The trend for casualties per 1,000 fire incidents is dropping. Compared to the Texas value the number of injuries per 1,000 fire incidents is much higher.
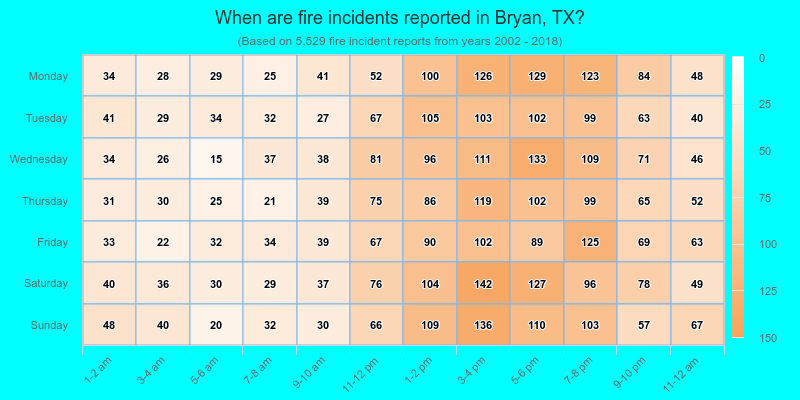
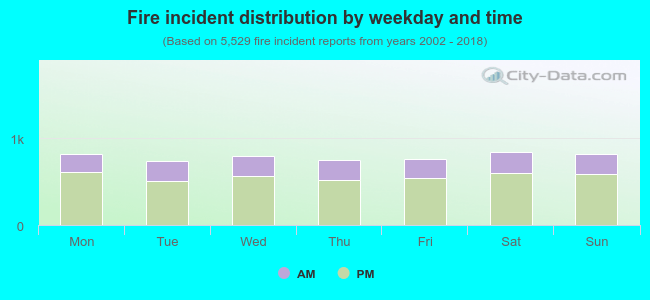 29.0% incidents where reported in the morning and 71.0% in the evening. The most fires (15.3%) took place on Saturday, and the least (13.4%) on Tuesday.
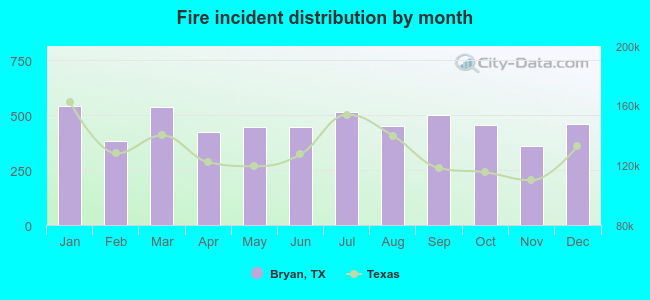 According to the 5,529 fire incidents from years 2002 - 2018 most fires (9.8%) took place during January, and the least (6.5%) in November.
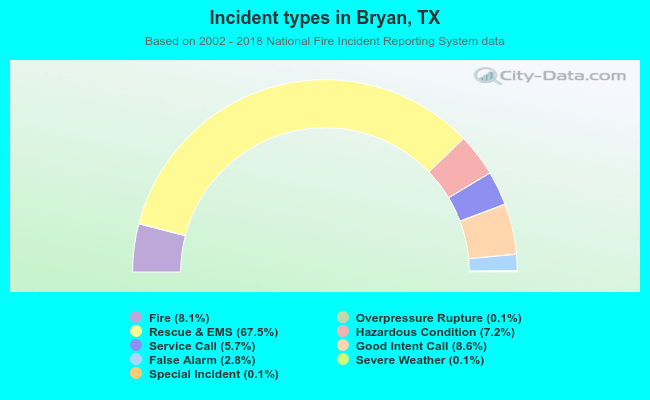 Out of all 68,352 cases reported during the years 2002 - 2018, the most belonged to the categories: Rescue & EMS (67.5%), Good Intent Call (8.6%), and Fire (8.1%).
 When looking into fire subcategories, the most incidents belonged to: Outside Fires (44.6%), and Structure Fires (36.6%).