Hempstead: Fire Incidents, New York (NY)
Where are fire incidents reported in Hempstead, NY
Something went wrong! Please refresh the page.
| Fire incidents reported | |
|---|---|
| Sreet name | Count |
| FULTON AVENUE | 384 |
| TERRACE AVENUE | 272 |
| SOUTH FRANKLIN STREET | 226 |
| FRONT STREET | 178 |
| JACKSON STREET | 124 |
| NORTH FRANKLIN STREET | 98 |
| GREENWICH STREET | 96 |
| PENINSULA BOULEVARD | 82 |
| ST PAULS ROAD NORTH | 80 |
| MAIN STREET | 78 |
| CLINTON STREET | 74 |
| MANOR AVENUE | 60 |
| JERUSALEM AVENUE | 58 |
| WASHINGTON STREET | 54 |
| WEST COLUMBIA STREET | 54 |
| BALDWIN ROAD | 36 |
| HILTON AVENUE | 32 |
| STEWART AVENUE | 30 |
| GROVE STREET | 28 |
| DARTMOUTH STREET | 26 |
| ELMWOOD AVENUE | 26 |
| HENRY STREET | 26 |
| YALE STREET | 26 |
| CLINTON ST | 24 |
| ELK STREET | 24 |
| TERRACE AVE | 24 |
| WEIR STREET | 24 |
| BELMONT PARKWAY | 22 |
| CATHEDRAL AVENUE | 22 |
| LONG BEACH ROAD | 22 |
2004 - 2018 National Fire Incident Reporting System (NFIRS) incidents
- Incident types reported to NFIRS in Hempstead, NY
- 2,21226.5%Fire
- 2,07324.9%Hazardous Condition
- 2,01824.2%False Alarm
- 87210.5%Rescue & EMS
- 6718.0%Service Call
- 4495.4%Good Intent Call
- 240.3%Special Incident
- 190.2%Overpressure Rupture
- Fire incident types reported to NFIRS in Hempstead, NY
- 1,43664.9%Structure Fires
- 35015.8%Outside Fires
- 26712.1%Mobile Property/Vehicle Fires
- 1597.2%Other
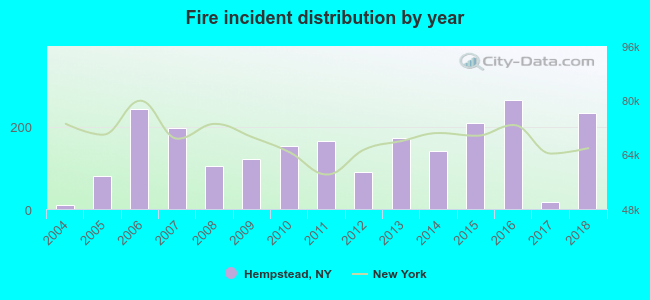 According to the data from the years 2004 - 2018 the average number of fire incidents per year is 147. The highest number of fire incidents - 264 took place in 2016, and the least - 9 in 2004. The data has a growing trend.
The average number of yearly fire incidents per 10k residents in Hempstead, NY compared to nearest cities:
(Note: Based on data for the last 3 years, including only cities with population 5,000 and above)
| Hempstead: | 31.0 |
| Uniondale: | 5.1 |
| West Hempstead: | 19.8 |
| Garden City: | 21.7 |
| Roosevelt: | 39.4 |
| Lakeview: | 6.5 |
| Baldwin: | 29.4 |
| Rockville Centre: | 19.6 |
| Franklin Square: | 5.1 |
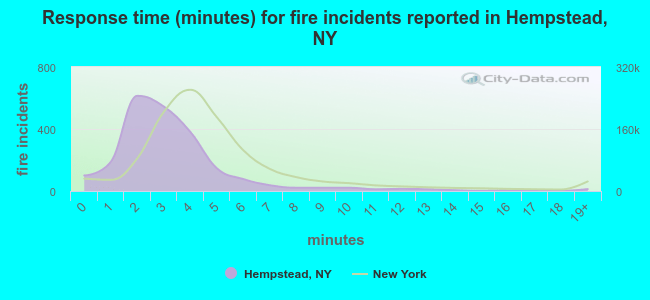 The median response time based on all reported fire incidents is 3 minutes. This is lower than the New York median value.
The median response time in Hempstead, NY compared to nearest cities:
(Note: Based on data for all years, including only cities with at least 500 fire incidents)
| Hempstead: | 3 minutes |
| West Hempstead: | 0 minutes |
| Garden City: | 3 minutes |
| Baldwin: | 4 minutes |
| Franklin Square: | 4 minutes |
| Freeport: | 3 minutes |
| New Hyde Park: | 4 minutes |
| Lynbrook: | 3 minutes |
| Elmont: | 5 minutes |
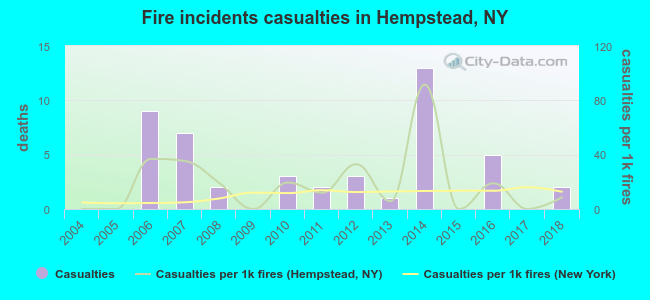 According to the data from the years 2004 - 2018 the average number of fire-related yearly casualties is 3. The highest number of casualties - 13 took place in 2014, and the lowest - 0 in 2004. The data has a growing trend.
The average number of injuries per 1,000 fires is 19. This indicator was the highest - 92 in 2014, and the lowest 0 in 2004. The trend for injuries per 1,000 incidents is increasing. Compared to the state value the number of casualties per 1,000 incidents is much higher.
According to the data from the years 2004 - 2018 the average number of fire-related yearly casualties is 3. The highest number of casualties - 13 took place in 2014, and the lowest - 0 in 2004. The data has a growing trend.
The average number of injuries per 1,000 fires is 19. This indicator was the highest - 92 in 2014, and the lowest 0 in 2004. The trend for injuries per 1,000 incidents is increasing. Compared to the state value the number of casualties per 1,000 incidents is much higher.Casualties per 1,000 incidents in Hempstead, NY compared to nearest cities:
(Note: Based on data for all years, including only cities with at least 500 fire incidents)
| Hempstead: | 21.2 |
| West Hempstead: | 0.0 |
| Garden City: | 11.3 |
| Baldwin: | 1.2 |
| Franklin Square: | 9.7 |
| Freeport: | 46.4 |
| New Hyde Park: | 1.5 |
| Lynbrook: | 43.6 |
| Elmont: | 0.0 |
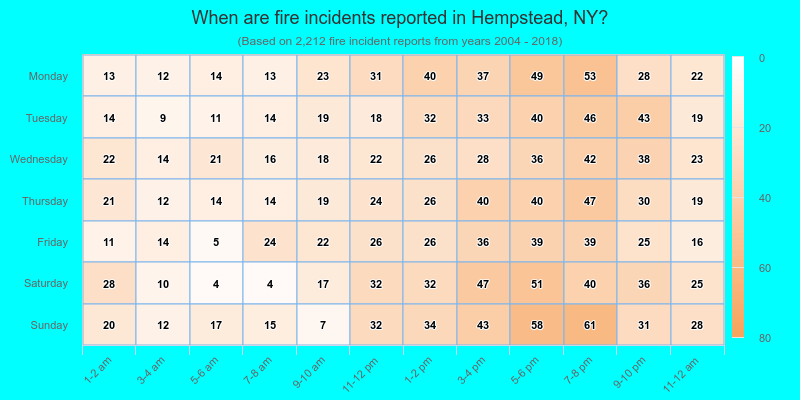
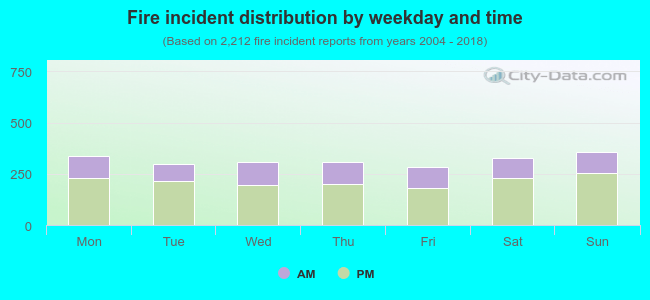 32.0% incidents where reported in the morning and 68.0% in the evening. The most fires (16.2%) took place on Sunday, and the least (12.8%) on Friday.
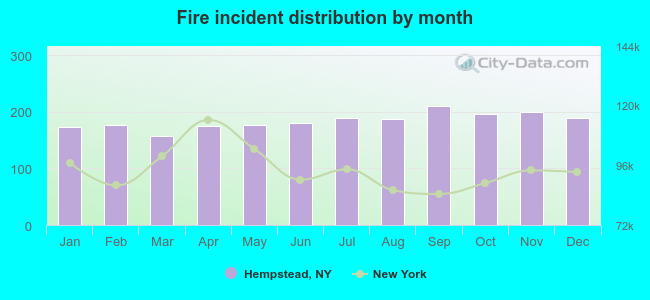 According to the 2,212 fires from years 2004 - 2018 most fires (9.5%) took place during September, and the least (7.1%) in March.
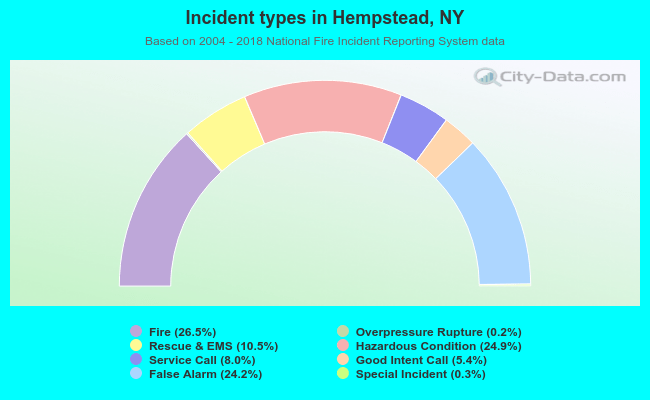 Out of all 8,338 cases reported during the years 2004 - 2018, the most belonged to the categories: Fire (26.5%), Hazardous Condition (24.9%), and False Alarm (24.2%).
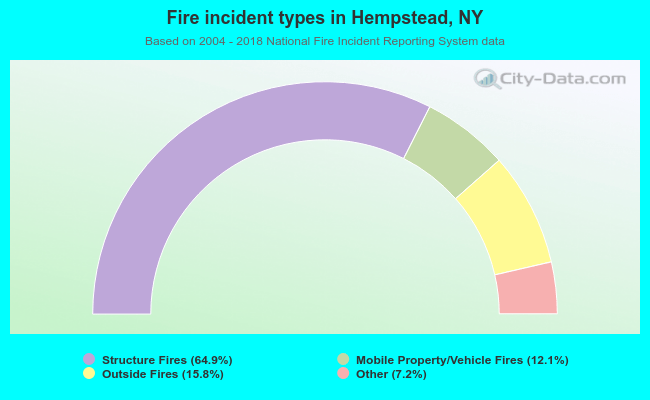 When looking into fire subcategories, the most reports belonged to: Structure Fires (64.9%), and Outside Fires (15.8%).