Freeport: Fire Incidents, New York (NY)
Where are fire incidents reported in Freeport, NY
Something went wrong! Please refresh the page.
| Fire incidents reported | |
|---|---|
| Sreet name | Count |
| BROADWAY | 124 |
| E SUNRISE HWY | 24 |
| MERRICK RD | 18 |
| MAIN ST N | 16 |
| SMITH ST | 16 |
| W SUNRISE HWY | 16 |
| GUY LOMBARDO AVE | 14 |
| PINE ST | 14 |
| 100 MILL ROAD | 12 |
| ATLANTIC AVE | 12 |
| E FREEPORT PLAZ | 12 |
| LONG BEACH AVE S | 12 |
| N BROOKSIDE AVE | 12 |
| PENNSYLVANIA AVE | 12 |
| SOUTHSIDE AVE | 12 |
| HANSE AVE | 10 |
| RANDALL AVE | 10 |
| 10 BROOKLYN AVE | 8 |
| 30 WALLACE ST | 8 |
| 76 S BERGEN PL | 8 |
| ARCHER ST | 8 |
| CENTRE ST | 8 |
| FOREST AVE | 8 |
| N MAIN ST | 8 |
| NASSAU AVE | 8 |
| ROSE ST | 8 |
| S LONG BEACH AVE | 8 |
| S MAIN ST | 8 |
| ST MARKS AVE | 8 |
| WOODSIDE AVE | 8 |
| Other | 348 |
2006 - 2018 National Fire Incident Reporting System (NFIRS) incidents
- Incident types reported to NFIRS in Freeport, NY
- 1,77028.4%False Alarm
- 1,46623.5%Rescue & EMS
- 1,00516.1%Hazardous Condition
- 79812.8%Fire
- 65210.5%Service Call
- 5358.6%Good Intent Call
- 70.1%Special Incident
- Fire incident types reported to NFIRS in Freeport, NY
- 42453.1%Structure Fires
- 21026.3%Outside Fires
- 10212.8%Mobile Property/Vehicle Fires
- 627.8%Other
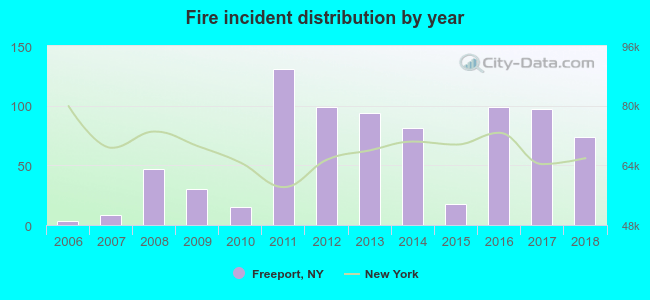 According to the data from the years 2006 - 2018 the average number of fires per year is 61. The highest number of reported fire incidents - 131 took place in 2011, and the least - 3 in 2006. The data has an increasing trend.
The average number of yearly fire incidents per 10k residents in Freeport, NY compared to nearest cities:
(Note: Based on data for the last 3 years, including only cities with population 5,000 and above)
| Freeport: | 20.8 |
| Baldwin: | 29.4 |
| Roosevelt: | 39.4 |
| Merrick: | 13.0 |
| North Merrick: | 6.9 |
| Rockville Centre: | 19.6 |
| Oceanside: | 8.7 |
| Bellmore: | 6.0 |
| Uniondale: | 5.1 |
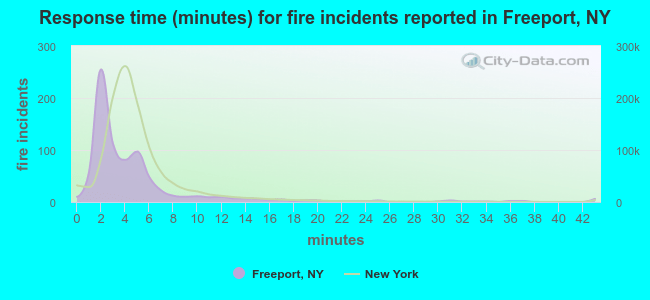 The median response time based on all reported fire incidents is 3 minutes. This is lower than the New York median value.
The median response time in Freeport, NY compared to nearest cities:
(Note: Based on data for all years, including only cities with at least 500 fire incidents)
| Freeport: | 3 minutes |
| Baldwin: | 4 minutes |
| Oceanside: | 4 minutes |
| Hempstead: | 3 minutes |
| Lynbrook: | 3 minutes |
| West Hempstead: | 0 minutes |
| Franklin Square: | 4 minutes |
| Garden City: | 3 minutes |
| Valley Stream: | 4 minutes |
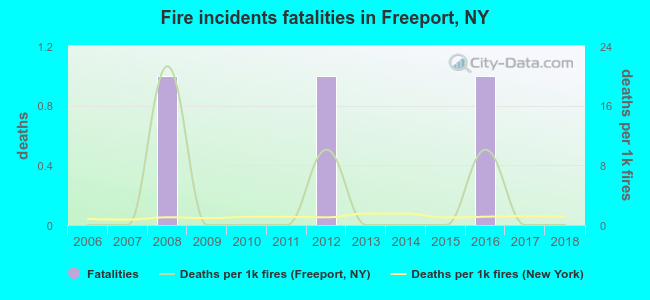 According to the reports from the years 2006 - 2018 the average number of fire-related fatalities per year is 0. The highest number of reported deaths - 1 took place in 2008, and the lowest - 0 in 2006. The data has a constant trend.
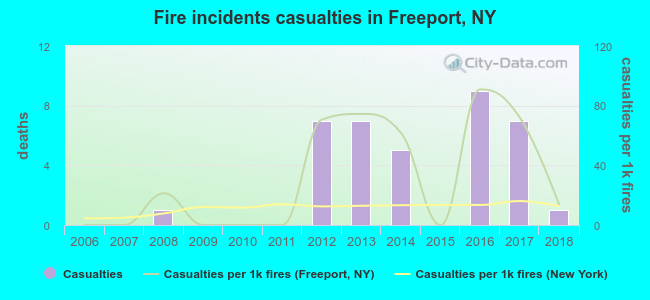 Based on the data from the years 2006 - 2018 the average number of fire-related casualties per year is 3. The highest number of reported casualties - 9 took place in 2016, and the lowest - 0 in 2006. The data has a growing trend.
The average number of injuries per 1,000 fire incidents is 31. This indicator was the highest - 91 in 2016, and the lowest 0 in 2006. The trend for casualties per 1,000 incidents is rising. Compared to the state value the number of injuries per 1,000 fires is much higher.
Based on the data from the years 2006 - 2018 the average number of fire-related casualties per year is 3. The highest number of reported casualties - 9 took place in 2016, and the lowest - 0 in 2006. The data has a growing trend.
The average number of injuries per 1,000 fire incidents is 31. This indicator was the highest - 91 in 2016, and the lowest 0 in 2006. The trend for casualties per 1,000 incidents is rising. Compared to the state value the number of injuries per 1,000 fires is much higher.Casualties per 1,000 incidents in Freeport, NY compared to nearest cities:
(Note: Based on data for all years, including only cities with at least 500 fire incidents)
| Freeport: | 46.4 |
| Baldwin: | 1.2 |
| Oceanside: | 12.8 |
| Hempstead: | 21.2 |
| Lynbrook: | 43.6 |
| West Hempstead: | 0.0 |
| Franklin Square: | 9.7 |
| Garden City: | 11.3 |
| Valley Stream: | 10.0 |
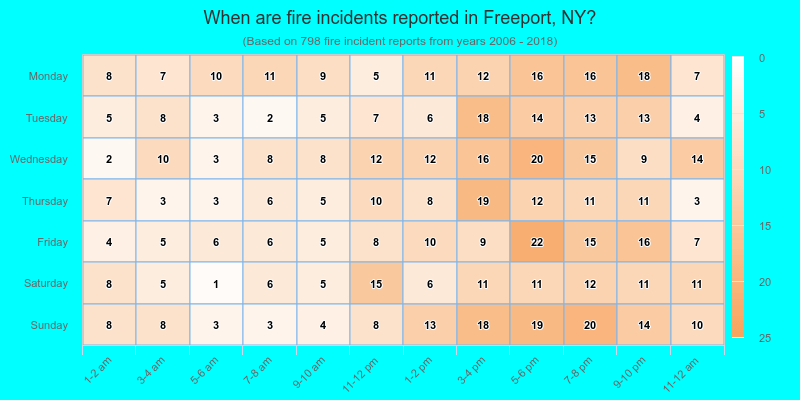
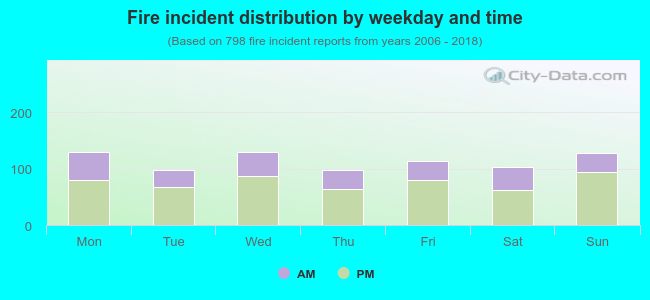 33.2% incidents where reported in the morning and 66.8% in the evening. The most fires (16.3%) took place on Monday, and the least (12.3%) on Tuesday.
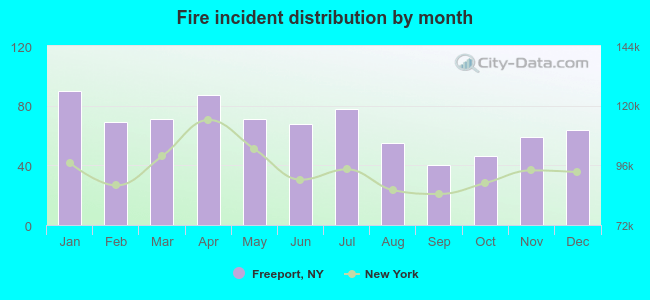 According to the 798 incident reports from years 2006 - 2018 most fires (11.3%) took place during January, and the least (5.0%) in September.
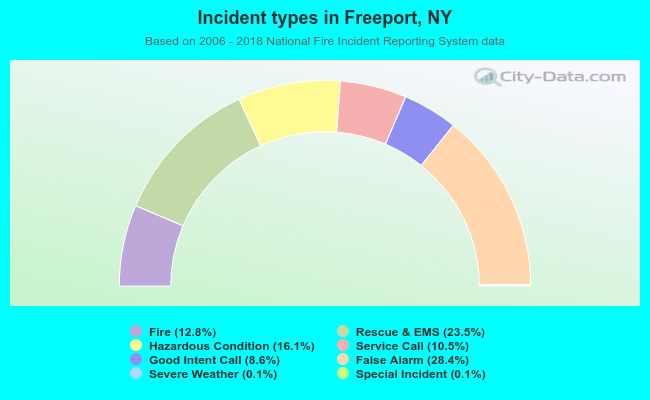 Out of all 6,237 cases reported during the years 2006 - 2018, the most belonged to the categories: Good Intent Call (28.4%), Overpressure Rupture (23.5%), and Rescue & EMS (16.1%).
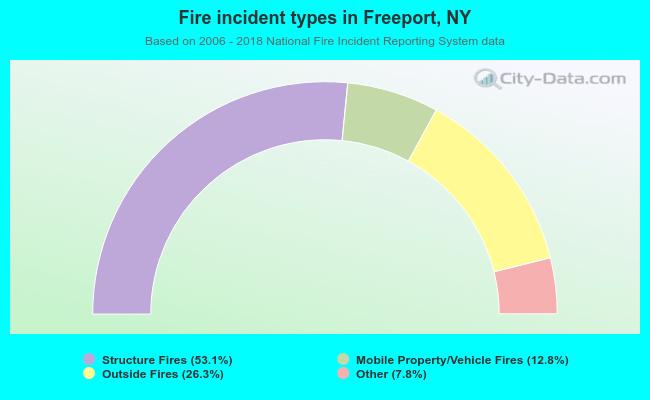 When looking into fire subcategories, the most incidents belonged to: Structure Fires (53.1%), and Outside Fires (26.3%).