Heyburn: Fire Incidents, Idaho (ID)
Where are fire incidents reported in Heyburn, ID
Something went wrong! Please refresh the page.
|
| |||||||||||||||||||||||||||||||||||||||||||||||||||||||||||||||||||||||||||||||||||||||||||||||||||||||||||||
| Other | 340 | |||||||||||||||||||||||||||||||||||||||||||||||||||||||||||||||||||||||||||||||||||||||||||||||||||||||||||||
2002 - 2018 National Fire Incident Reporting System (NFIRS) incidents
- Incident types reported to NFIRS in Heyburn, ID
- 91848.3%Rescue & EMS
- 56029.5%Fire
- 1819.5%Hazardous Condition
- 1065.6%Good Intent Call
- 653.4%False Alarm
- 633.3%Service Call
- 50.3%Special Incident
- 20.1%Overpressure Rupture
- Fire incident types reported to NFIRS in Heyburn, ID
- 34862.1%Outside Fires
- 13123.4%Structure Fires
- 7613.6%Mobile Property/Vehicle Fires
- 50.9%Other
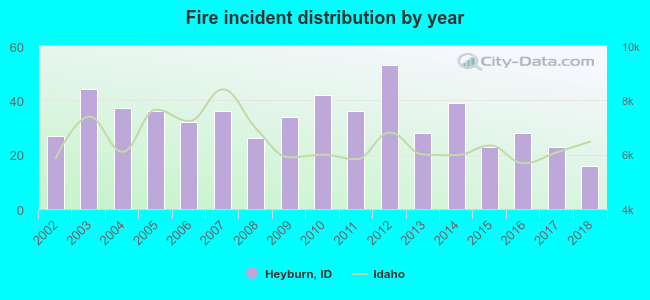 Based on the data from the years 2002 - 2018 the average number of fire incidents per year is 33. The highest number of reported fires - 53 took place in 2012, and the least - 16 in 2018. The data has a decreasing trend.
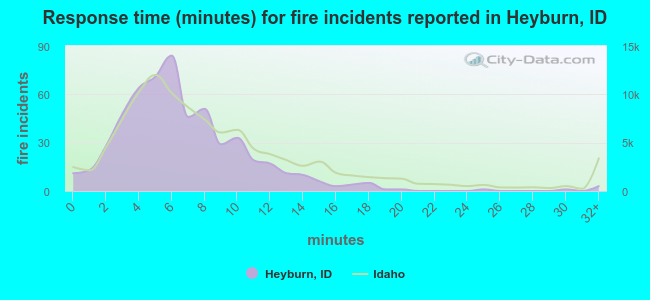 The median response time based on all reported fire incidents is 6 minutes. This is close to the state median value.
The median response time in Heyburn, ID compared to nearest cities:
(Note: Based on data for all years, including only cities with at least 500 fire incidents)
| Heyburn: | 6 minutes |
| Burley: | 6 minutes |
| Paul: | 6 minutes |
| Rupert: | 6 minutes |
| Kimberly: | 9 minutes |
| Twin Falls: | 5 minutes |
| Jerome: | 7 minutes |
| Filer: | 9 minutes |
| Wendell: | 8 minutes |
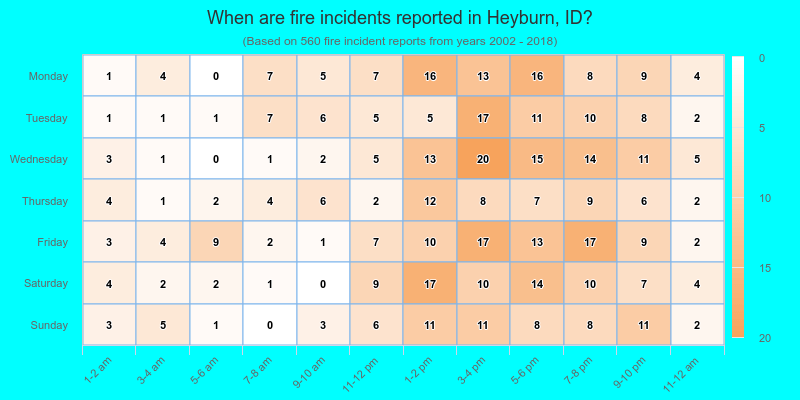
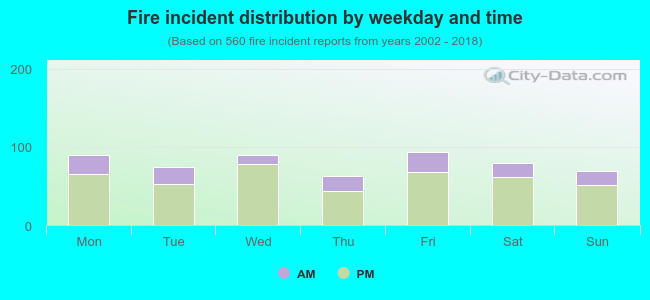 24.6% incidents where reported in the morning and 75.4% in the evening. The most fires (16.8%) took place on Friday, and the least (11.3%) on Thursday.
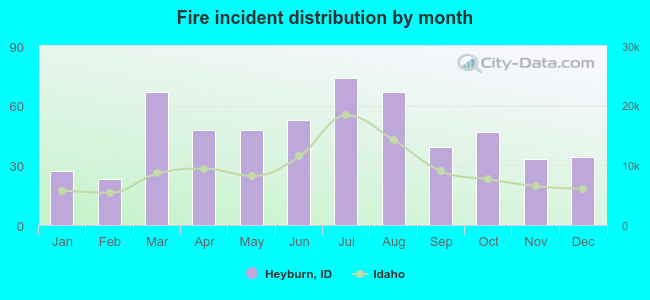 Based on the 560 fire incidents from years 2002 - 2018 most fires (13.2%) took place during July, and the least (4.1%) in February.
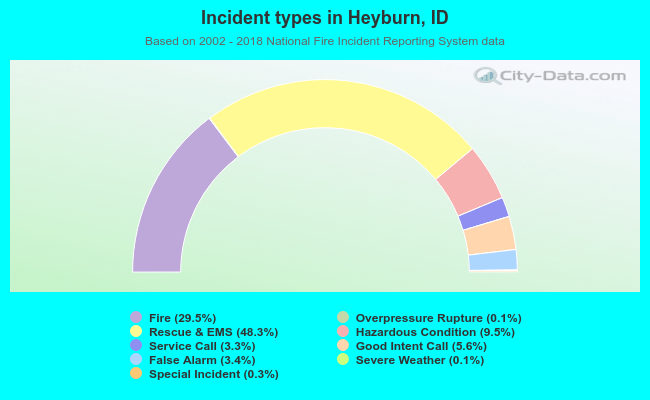 Out of all 1,901 cases reported during the years 2002 - 2018, the most belonged to the categories: Rescue & EMS (48.3%), Fire (29.5%), and Hazardous Condition (9.5%).
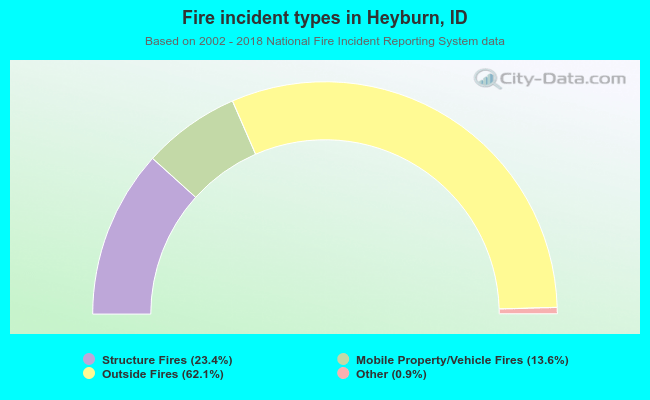 When looking into fire subcategories, the most reports belonged to: Outside Fires (62.1%), and Structure Fires (23.4%).