Highland Springs: Fire Incidents, Virginia (VA)
Where are fire incidents reported in Highland Springs, VA
Something went wrong! Please refresh the page.
| Fire incidents reported | |
|---|---|
| Sreet name | Count |
| E NINE MILE RD | 30 |
| N AIRPORT DR | 28 |
| E NINE MILE RD | 26 |
| HODDER LN | 26 |
| AIRPORT PL | 24 |
| S OAK AV | 24 |
| N ELM AVE | 22 |
| N IVY AV | 22 |
| S OAK AVE | 22 |
| W NINE MILE RD | 22 |
| S AIRPORT DR | 20 |
| CARLSTONE DR | 18 |
| HIBISCUS DR | 18 |
| N IVY AVE | 18 |
| REPP CIR | 18 |
| AIRPORT DR | 16 |
| N JUNIPER AVE | 16 |
| N MAPLELEAF AVE | 14 |
| N QUINCE AVE | 14 |
| NINE MILE RD | 14 |
| S AIRPORT DR | 14 |
| S CEDAR AVE | 14 |
| WALES DR | 14 |
| CHIPPER WAY | 12 |
| E WASHINGTON ST | 12 |
| LEE AVE | 12 |
| N OAK AVE | 12 |
| A P HILL AVE | 10 |
| BRIDGE ST | 10 |
| E JERALD ST | 10 |
| Other | 75 |
2002 - 2018 National Fire Incident Reporting System (NFIRS) incidents
- Incident types reported to NFIRS in Highland Springs, VA
- 7,08673.6%Rescue & EMS
- 6847.1%Hazardous Condition
- 6076.3%Fire
- 5335.5%Good Intent Call
- 3553.7%Service Call
- 3053.2%False Alarm
- 250.3%Severe Weather
- 190.2%Special Incident
- 110.1%Overpressure Rupture
- Fire incident types reported to NFIRS in Highland Springs, VA
- 24440.2%Structure Fires
- 20333.4%Outside Fires
- 12320.3%Mobile Property/Vehicle Fires
- 376.1%Other
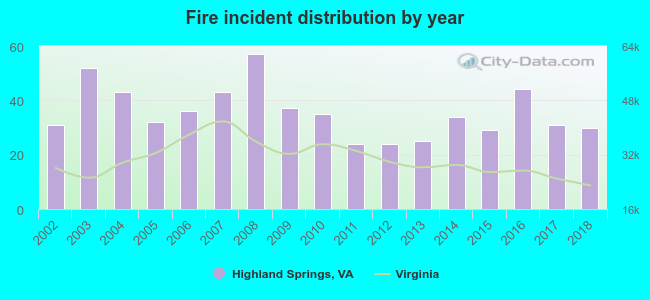 Based on the data from the years 2002 - 2018 the average number of fires per year is 36. The highest number of fires - 57 took place in 2008, and the least - 24 in 2011. The data has a dropping trend.
The average number of yearly fire incidents per 10k residents in Highland Springs, VA compared to nearest cities:
(Note: Based on data for the last 3 years, including only cities with population 5,000 and above)
| Highland Springs: | 22.3 |
| Sandston: | 66.5 |
| Mechanicsville: | 60.6 |
| Richmond: | 66.9 |
| Bensley: | 56.7 |
| Bellwood: | 45.7 |
| Glen Allen: | 76.3 |
| Bon Air: | 18.3 |
| Chester: | 80.8 |
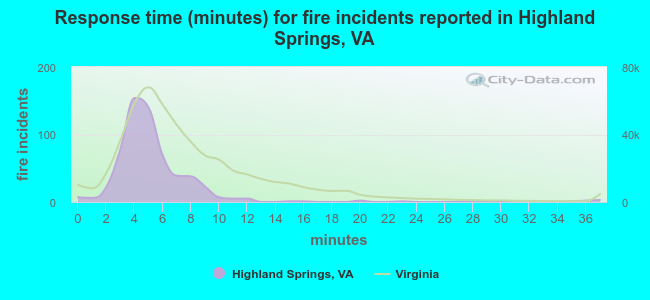 The median response time based on all reported fire incidents is 5 minutes. This is lower compared to the state median value.
The median response time in Highland Springs, VA compared to nearest cities:
(Note: Based on data for all years, including only cities with at least 500 fire incidents)
| Highland Springs: | 5 minutes |
| Sandston: | 6 minutes |
| Mechanicsville: | 8 minutes |
| Richmond: | 5 minutes |
| Glen Allen: | 6 minutes |
| Chester: | 6 minutes |
| Ashland: | 8 minutes |
| Hopewell: | 5 minutes |
| Charles City: | 16 minutes |
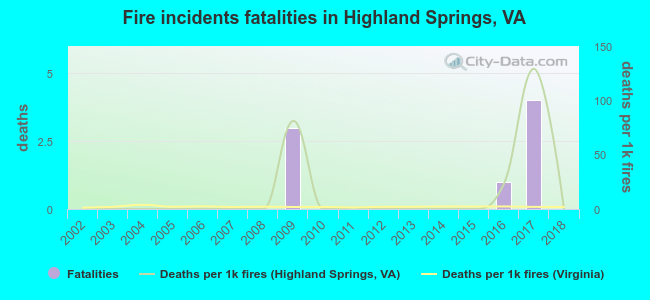 According to the reports from the years 2002 - 2018 the average number of fire-related fatalities per year is 0. The highest number of deaths - 4 took place in 2017, and the lowest - 0 in 2002. The data has a constant trend.
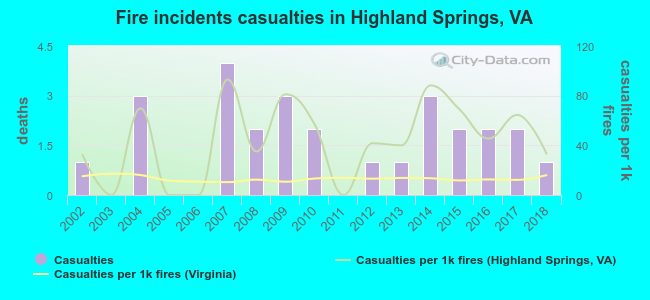 Based on the reports from the years 2002 - 2018 the average number of fire-related casualties per year is 2. The highest number of casualties - 4 took place in 2007, and the lowest - 0 in 2003. The data has a constant trend.
The average number of casualties per 1,000 fire incidents is 44. This indicator was the highest - 93 in 2007, and the lowest 0 in 2003. The trend for casualties per 1,000 fires is growing. Compared to the Virginia value the number of injuries per 1,000 fires is much higher.
Based on the reports from the years 2002 - 2018 the average number of fire-related casualties per year is 2. The highest number of casualties - 4 took place in 2007, and the lowest - 0 in 2003. The data has a constant trend.
The average number of casualties per 1,000 fire incidents is 44. This indicator was the highest - 93 in 2007, and the lowest 0 in 2003. The trend for casualties per 1,000 fires is growing. Compared to the Virginia value the number of injuries per 1,000 fires is much higher.Casualties per 1,000 incidents in Highland Springs, VA compared to nearest cities:
(Note: Based on data for all years, including only cities with at least 500 fire incidents)
| Highland Springs: | 44.5 |
| Sandston: | 18.9 |
| Mechanicsville: | 4.6 |
| Richmond: | 26.0 |
| Glen Allen: | 24.1 |
| Chester: | 40.8 |
| Ashland: | 6.1 |
| Hopewell: | 36.9 |
| Charles City: | 0.0 |
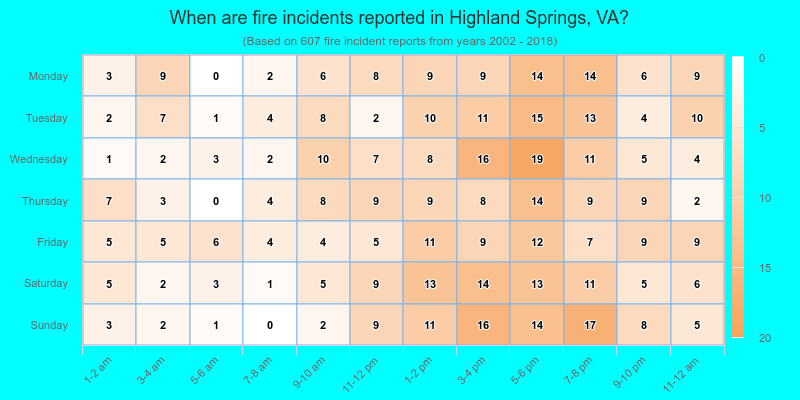
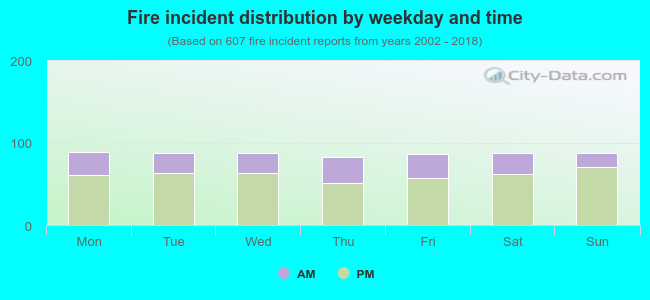 29.5% incidents where reported in the morning and 70.5% in the evening. The most fires (14.7%) took place on Monday, and the least (13.5%) on Thursday.
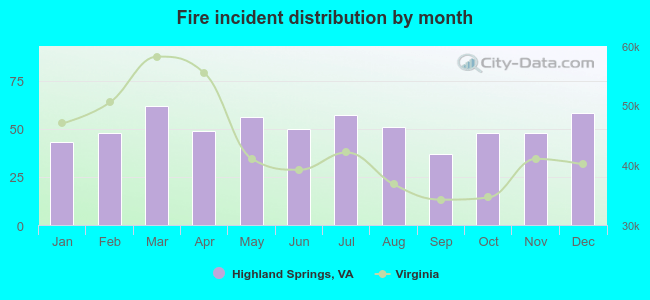 According to the 607 fire incident reports from years 2002 - 2018 most fires (10.2%) took place during March, and the least (6.1%) in September.
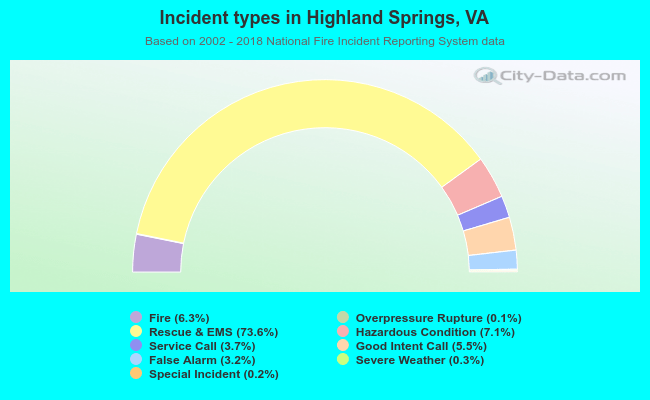 Out of all 9,625 cases reported during the years 2002 - 2018, the most belonged to the categories: Rescue & EMS (73.6%), Hazardous Condition (7.1%), and Fire (6.3%).
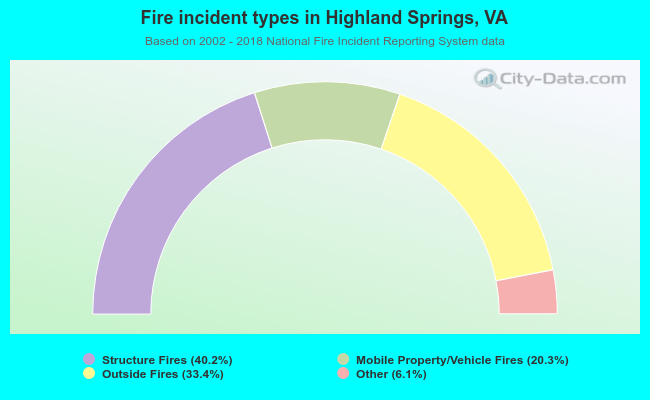 When looking into fire subcategories, the most reports belonged to: Structure Fires (40.2%), and Outside Fires (33.4%).