Mechanicsville: Fire Incidents, Virginia (VA)
Where are fire incidents reported in Mechanicsville, VA
Something went wrong! Please refresh the page.
| Fire incidents reported | |
|---|---|
| Sreet name | Count |
| INTERSTATE 295 | 388 |
| MECHANICSVILLE TPKE | 302 |
| CHAMBERLAYNE RD | 194 |
| BELL CREEK RD | 190 |
| COVENANT WOODS DR | 172 |
| ATLEE RD | 170 |
| MECHANICSVILLE TP | 120 |
| POLE GREEN RD | 114 |
| COLD HARBOR RD | 106 |
| MECHANICSVILLE | 106 |
| STUDLEY RD | 106 |
| I295 | 88 |
| RURAL POINT RD | 78 |
| OLD CHURCH RD | 76 |
| SHADY GROVE RD | 72 |
| VERDI LN | 60 |
| WALNUT GROVE RD | 58 |
| RICHFOOD RD | 56 |
| I-295 | 52 |
| LEEDAVIS RD | 48 |
| MEADOWBRIDGE RD | 48 |
| CREIGHTON RD | 46 |
| GARDEN PARK LN | 46 |
| LEE-DAVIS RD | 46 |
| ATLEE STATION RD | 44 |
| GEORGETOWN RD | 40 |
| MCCLELLAN RD | 40 |
| COOL SPRING RD | 38 |
| NEW ASHCAKE RD | 36 |
| ROCKHILL RD | 36 |
| Other | 966 |
2002 - 2018 National Fire Incident Reporting System (NFIRS) incidents
- Incident types reported to NFIRS in Mechanicsville, VA
- 12,31638.9%Rescue & EMS
- 6,68021.1%Good Intent Call
- 3,94212.4%Fire
- 3,89712.3%Hazardous Condition
- 2,3567.4%False Alarm
- 2,2587.1%Service Call
- 970.3%Special Incident
- 960.3%Severe Weather
- 470.1%Overpressure Rupture
- Fire incident types reported to NFIRS in Mechanicsville, VA
- 1,85347.0%Structure Fires
- 1,14229.0%Outside Fires
- 63616.1%Mobile Property/Vehicle Fires
- 3117.9%Other
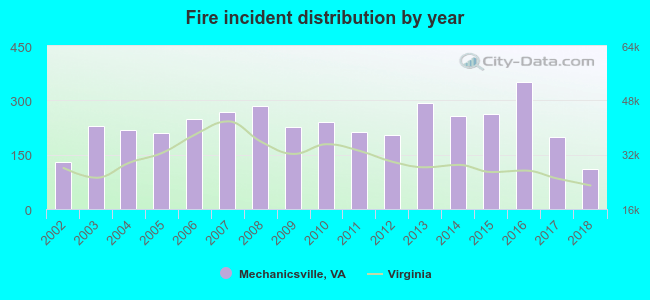 Based on the data from the years 2002 - 2018 the average number of fire incidents per year is 232. The highest number of reported fire incidents - 351 took place in 2016, and the least - 110 in 2018. The data has a decreasing trend.
The average number of yearly fire incidents per 10k residents in Mechanicsville, VA compared to nearest cities:
(Note: Based on data for the last 3 years, including only cities with population 5,000 and above)
| Mechanicsville: | 60.6 |
| Highland Springs: | 22.3 |
| Sandston: | 66.5 |
| Glen Allen: | 76.3 |
| Richmond: | 66.9 |
| Ashland: | 120.5 |
| Bensley: | 56.7 |
| Bon Air: | 18.3 |
| Bellwood: | 45.7 |
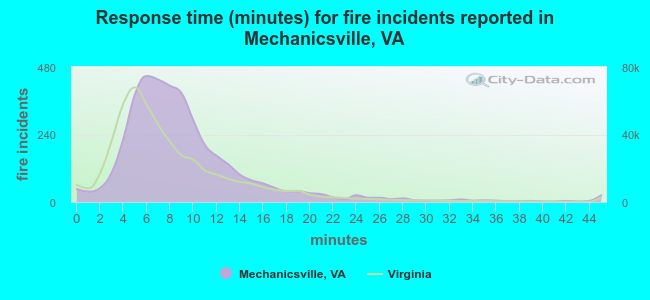 The median response time based on all reported fire incidents is 8 minutes. This is similar to the state median value.
The median response time in Mechanicsville, VA compared to nearest cities:
(Note: Based on data for all years, including only cities with at least 500 fire incidents)
| Mechanicsville: | 8 minutes |
| Highland Springs: | 5 minutes |
| Sandston: | 6 minutes |
| Glen Allen: | 6 minutes |
| Richmond: | 5 minutes |
| Ashland: | 8 minutes |
| Chester: | 6 minutes |
| Hopewell: | 5 minutes |
| Charles City: | 16 minutes |
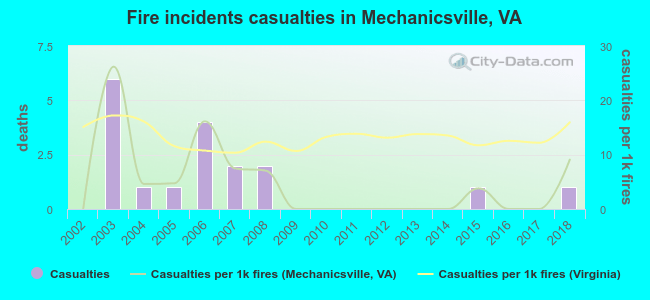 According to the data from the years 2002 - 2018 the average number of fire-related yearly casualties is 1. The highest number of casualties - 6 took place in 2003, and the lowest - 0 in 2002. The data has a growing trend.
The average number of injuries per 1,000 fire incidents is 5. This indicator was the highest - 26 in 2003, and the lowest 0 in 2002. The trend for injuries per 1,000 fires is growing. Compared to the state value the number of injuries per 1,000 fires is much lower.
According to the data from the years 2002 - 2018 the average number of fire-related yearly casualties is 1. The highest number of casualties - 6 took place in 2003, and the lowest - 0 in 2002. The data has a growing trend.
The average number of injuries per 1,000 fire incidents is 5. This indicator was the highest - 26 in 2003, and the lowest 0 in 2002. The trend for injuries per 1,000 fires is growing. Compared to the state value the number of injuries per 1,000 fires is much lower.Casualties per 1,000 incidents in Mechanicsville, VA compared to nearest cities:
(Note: Based on data for all years, including only cities with at least 500 fire incidents)
| Mechanicsville: | 4.6 |
| Highland Springs: | 44.5 |
| Sandston: | 18.9 |
| Glen Allen: | 24.1 |
| Richmond: | 26.0 |
| Ashland: | 6.1 |
| Chester: | 40.8 |
| Hopewell: | 36.9 |
| Charles City: | 0.0 |
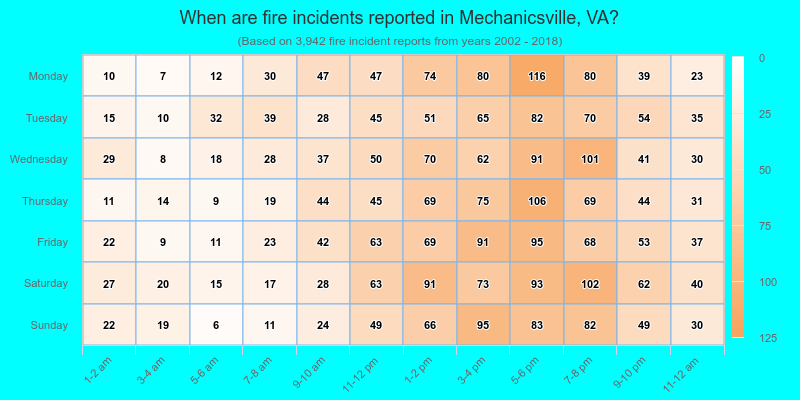
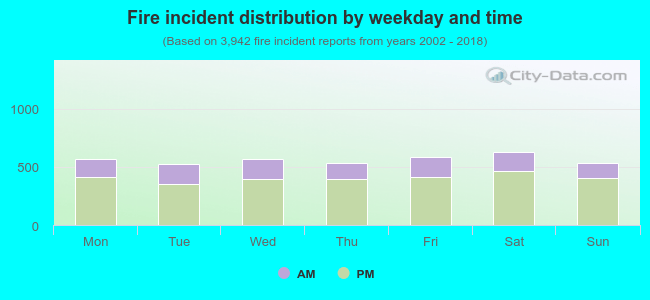 28.0% incidents where reported in the morning and 72.0% in the evening. The most fires (16.0%) took place on Saturday, and the least (13.3%) on Tuesday.
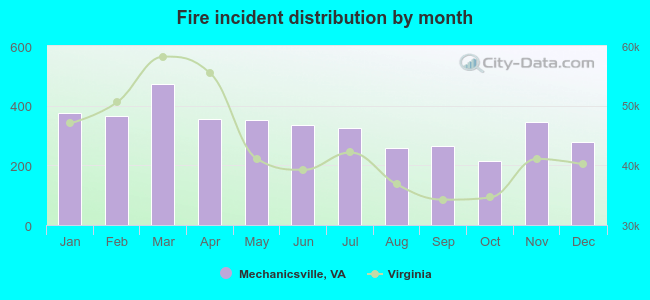 Based on the 3,942 incident reports from years 2002 - 2018 most fires (12.0%) took place during March, and the least (5.4%) in October.
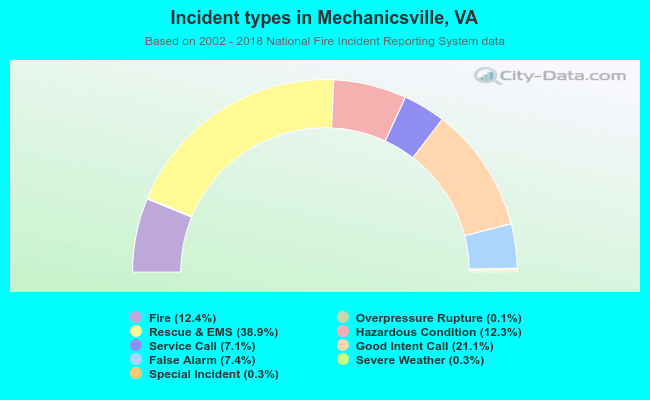 Out of all 31,689 cases reported during the years 2002 - 2018, the most belonged to the categories: Rescue & EMS (38.9%), Good Intent Call (21.1%), and Fire (12.4%).
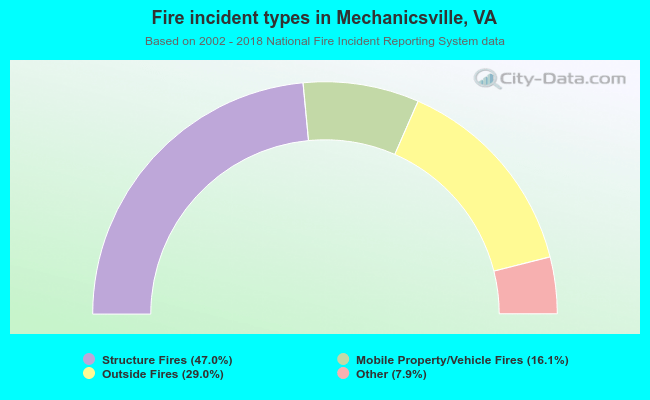 When looking into fire subcategories, the most incidents belonged to: Structure Fires (47.0%), and Outside Fires (29.0%).