Holmen: Fire Incidents, Wisconsin (WI)
Where are fire incidents reported in Holmen, WI
Something went wrong! Please refresh the page.
|
| |||||||||||||||||||||||||||||||||||||||||||||||||||||||||||||||||||||||||||||||||||||||||||||||||||||||||||||
2002 - 2018 National Fire Incident Reporting System (NFIRS) incidents
- Incident types reported to NFIRS in Holmen, WI
- 1,83666.9%Rescue & EMS
- 2579.4%Hazardous Condition
- 2097.6%False Alarm
- 1605.8%Good Intent Call
- 1465.3%Fire
- 1114.0%Service Call
- 130.5%Severe Weather
- 110.4%Special Incident
- Fire incident types reported to NFIRS in Holmen, WI
- 6141.8%Outside Fires
- 5235.6%Structure Fires
- 2315.8%Mobile Property/Vehicle Fires
- 106.8%Other
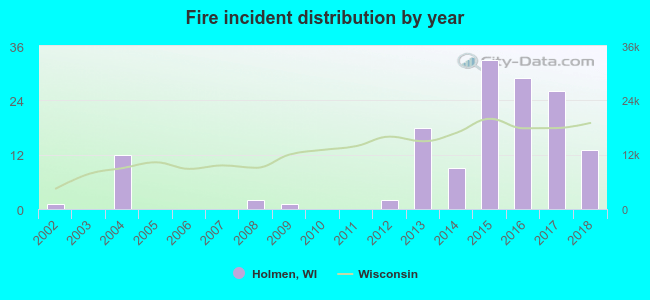 Based on the data from the years 2002 - 2018 the average number of fire incidents per year is 9. The highest number of fires - 33 took place in 2015, and the least - 0 in 2003. The data has an increasing trend.
The average number of yearly fire incidents per 10k residents in Holmen, WI compared to nearest cities:
(Note: Based on data for the last 3 years, including only cities with population 5,000 and above)
| Holmen: | 23.7 |
| Onalaska: | 11.1 |
| West Salem: | 35.3 |
| La Crosse: | 31.7 |
| Sparta: | 55.9 |

 26.0% incidents where reported in the morning and 74.0% in the evening. The most fires (25.3%) took place on Saturday, and the least (10.3%) on Sunday.
 Based on the 146 reports from years 2002 - 2018 most fires (22.6%) took place during April, and the least (3.4%) in December.
 Out of all 2,745 cases reported during the years 2002 - 2018, the most belonged to the categories: Rescue & EMS (66.9%), Hazardous Condition (9.4%), and False Alarm (7.6%).
 When looking into fire subcategories, the most incidents belonged to: Outside Fires (41.8%), and Structure Fires (35.6%).