La Crosse: Fire Incidents, Wisconsin (WI)
Where are fire incidents reported in La Crosse, WI
Something went wrong! Please refresh the page.
| Fire incidents reported | |
|---|---|
| Sreet name | Count |
| EAST AVE | 92 |
| 4TH ST | 90 |
| LIBERTY ST | 90 |
| ROSE ST | 84 |
| 7TH ST | 74 |
| 5TH AVE | 72 |
| COPELAND AVE | 68 |
| MORMON COULEE RD | 66 |
| GEORGE ST | 64 |
| STATE ST | 62 |
| 8TH ST | 58 |
| MAIN ST | 58 |
| MARKET ST | 54 |
| 9TH ST | 52 |
| JACKSON ST | 52 |
| 10TH ST | 50 |
| AVON ST | 50 |
| KANE ST | 50 |
| PINE ST | 50 |
| 6TH ST | 48 |
| CASS ST | 48 |
| VINE ST | 46 |
| CALEDONIA ST | 42 |
| WEST AVE | 42 |
| LOSEY BLVD | 36 |
| ST JAMES ST | 36 |
| 3RD ST | 34 |
| KING ST | 34 |
| CHARLES ST | 30 |
| MISSISSIPPI ST | 30 |
| Other | 316 |
2002 - 2018 National Fire Incident Reporting System (NFIRS) incidents
- Incident types reported to NFIRS in La Crosse, WI
- 16,88158.2%Rescue & EMS
- 3,23611.2%Hazardous Condition
- 2,7689.5%Service Call
- 2,5969.0%False Alarm
- 1,9786.8%Fire
- 1,4354.9%Good Intent Call
- 460.2%Overpressure Rupture
- 460.2%Special Incident
- Fire incident types reported to NFIRS in La Crosse, WI
- 89245.1%Structure Fires
- 53727.1%Outside Fires
- 32816.6%Mobile Property/Vehicle Fires
- 22111.2%Other
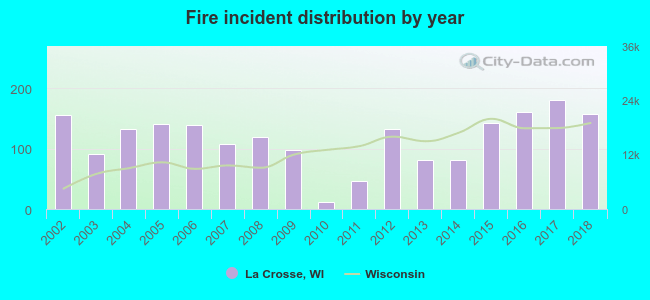 According to the data from the years 2002 - 2018 the average number of fire incidents per year is 116. The highest number of fire incidents - 180 took place in 2017, and the least - 12 in 2010. The data has a rising trend.
The average number of yearly fire incidents per 10k residents in La Crosse, WI compared to nearest cities:
(Note: Based on data for the last 3 years, including only cities with population 5,000 and above)
| La Crosse: | 31.7 |
| Onalaska: | 11.1 |
| West Salem: | 35.3 |
| Holmen: | 23.7 |
| Sparta: | 55.9 |
 The median response time based on all reported fire incidents is 5 minutes. This is lower than the state median value.
 Based on the reports from the years 2002 - 2018 the average number of fire-related fatalities per year is 0. The highest number of deaths - 2 took place in 2016, and the lowest - 0 in 2002. The data has a constant trend.
 According to the reports from the years 2002 - 2018 the average number of fire-related yearly casualties is 1. The highest number of injuries - 3 took place in 2011, and the lowest - 0 in 2002. The data has a constant trend.
The average number of injuries per 1,000 fire incidents is 9. This indicator was the highest - 64 in 2011, and the lowest 0 in 2002. The trend for injuries per 1,000 incidents is decreasing. Compared to the Wisconsin value the number of casualties per 1,000 fire incidents is lower.
According to the reports from the years 2002 - 2018 the average number of fire-related yearly casualties is 1. The highest number of injuries - 3 took place in 2011, and the lowest - 0 in 2002. The data has a constant trend.
The average number of injuries per 1,000 fire incidents is 9. This indicator was the highest - 64 in 2011, and the lowest 0 in 2002. The trend for injuries per 1,000 incidents is decreasing. Compared to the Wisconsin value the number of casualties per 1,000 fire incidents is lower.
 36.6% incidents where reported in the morning and 63.4% in the evening. The most fires (16.1%) took place on Saturday, and the least (12.7%) on Wednesday.
 According to the 1,978 fire incidents from years 2002 - 2018 most fires (11.3%) took place during July, and the least (6.1%) in February.
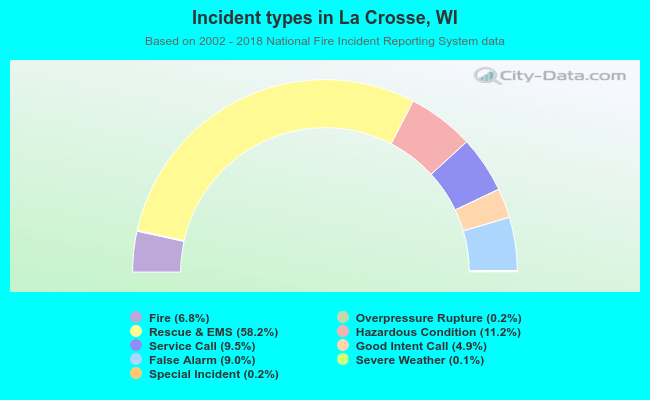 Out of all 29,005 cases reported during the years 2002 - 2018, the most belonged to the categories: Rescue & EMS (58.2%), Hazardous Condition (11.2%), and Service Call (9.5%).
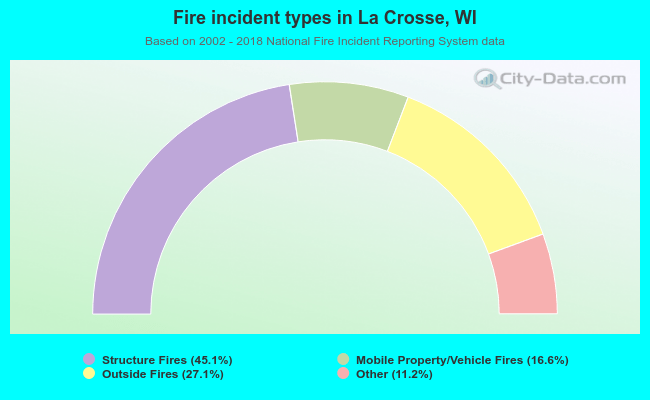 When looking into fire subcategories, the most incidents belonged to: Structure Fires (45.1%), and Outside Fires (27.1%).