Holton: Fire Incidents, Kansas (KS)
Where are fire incidents reported in Holton, KS
Something went wrong! Please refresh the page.
|
| |||||||||||||||||||||||||||||||||||||||||||||||||||||||||||||||||||||||||||||||||||||||||||||||||||||||||||||
2003 - 2018 National Fire Incident Reporting System (NFIRS) incidents
- Incident types reported to NFIRS in Holton, KS
- 64267.9%Fire
- 13514.3%Rescue & EMS
- 677.1%Good Intent Call
- 505.3%Hazardous Condition
- 293.1%Service Call
- 111.2%False Alarm
- 91.0%Special Incident
- 10.1%Overpressure Rupture
- 10.1%Severe Weather
- Fire incident types reported to NFIRS in Holton, KS
- 40963.7%Outside Fires
- 12219.0%Structure Fires
- 8312.9%Mobile Property/Vehicle Fires
- 284.4%Other
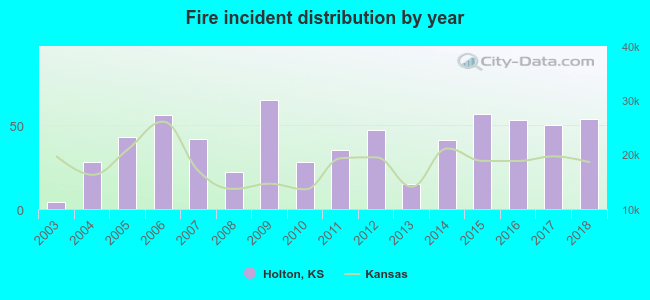 According to the data from the years 2003 - 2018 the average number of fires per year is 40. The highest number of fires - 65 took place in 2009, and the least - 4 in 2003. The data has a growing trend.
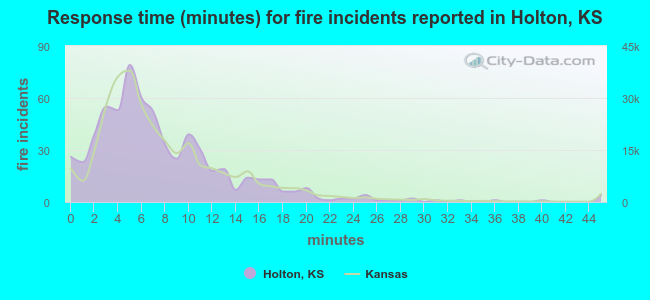 The median response time based on all reported fire incidents is 6 minutes. This is close to the Kansas median value.
The median response time in Holton, KS compared to nearest cities:
(Note: Based on data for all years, including only cities with at least 500 fire incidents)
| Holton: | 6 minutes |
| Mayetta: | 9 minutes |
| Hoyt: | 10 minutes |
| Horton: | 9 minutes |
| Meriden: | 12 minutes |
| Ozawkie: | 15 minutes |
| Silver Lake: | 11 minutes |
| Oskaloosa: | 12 minutes |
| Hiawatha: | 7 minutes |
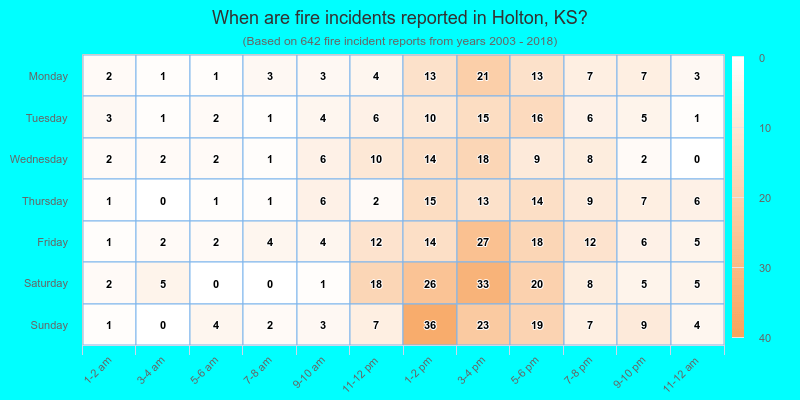
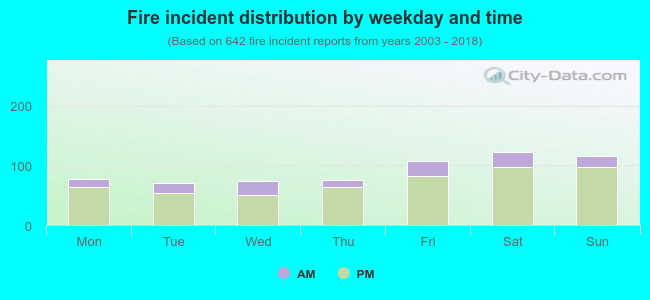 20.7% incidents where reported in the morning and 79.3% in the evening. The most fires (19.2%) took place on Saturday, and the least (10.9%) on Tuesday.
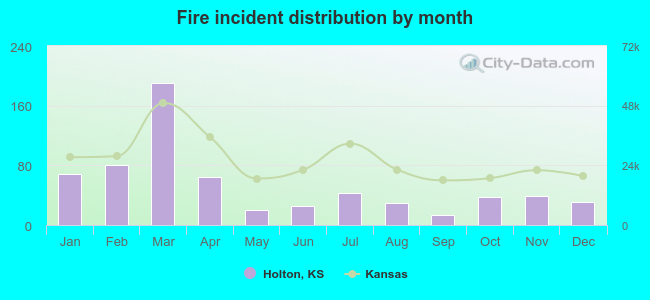 Based on the 642 fires from years 2003 - 2018 most fires (29.8%) took place during March, and the least (2.0%) in September.
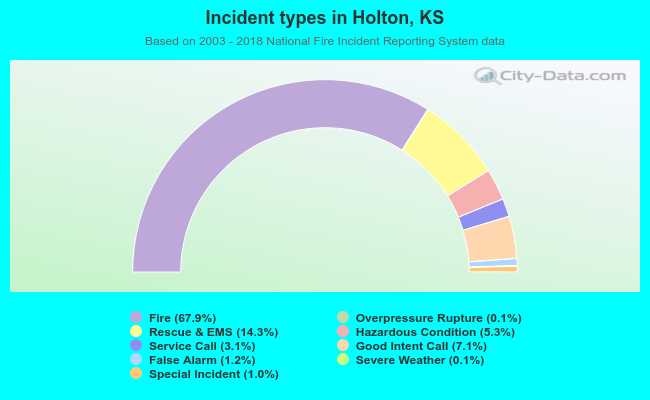 Out of all 945 cases reported during the years 2003 - 2018, the most belonged to the categories: Fire (67.9%), Rescue & EMS (14.3%), and Good Intent Call (7.1%).
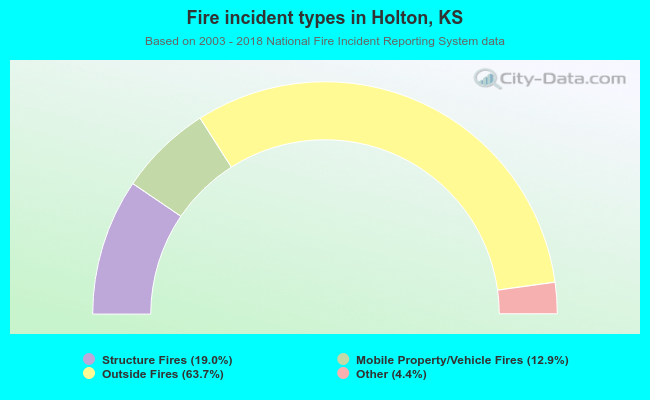 When looking into fire subcategories, the most incidents belonged to: Outside Fires (63.7%), and Structure Fires (19.0%).