Hoosick: Fire Incidents, New York (NY)
Where are fire incidents reported in Hoosick, NY
Something went wrong! Please refresh the page.
|
| |||||||||||||||||||||||||||||||||||||||||||||||||||||||||||||||||||||||||||||||||||||||||||||||||||||
2002 - 2018 National Fire Incident Reporting System (NFIRS) incidents
- Incident types reported to NFIRS in Hoosick, NY
- 28036.2%Rescue & EMS
- 18323.7%Fire
- 11214.5%Hazardous Condition
- 8310.7%Good Intent Call
- 607.8%Service Call
- 273.5%False Alarm
- 273.5%Severe Weather
- 10.1%Special Incident
- Fire incident types reported to NFIRS in Hoosick, NY
- 8848.1%Outside Fires
- 5932.2%Structure Fires
- 3519.1%Mobile Property/Vehicle Fires
- 10.5%Other
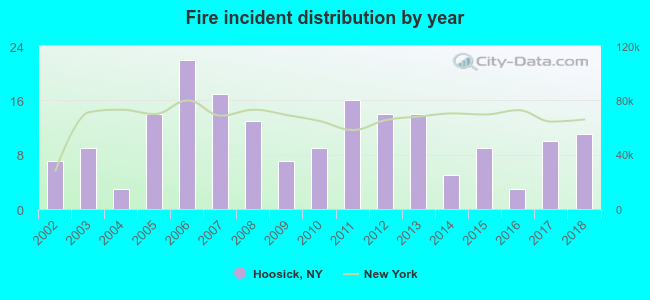 Based on the data from the years 2002 - 2018 the average number of fires per year is 11. The highest number of fire incidents - 22 took place in 2006, and the least - 3 in 2004. The data has an increasing trend.
The average number of yearly fire incidents per 10k residents in Hoosick, NY compared to nearest cities:
(Note: Based on data for the last 3 years, including only cities with population 5,000 and above)
| Hoosick: | 11.6 |
| Pittstown: | 2.3 |
| Mechanicville: | 55.4 |
| Brunswick: | 4.2 |
| Cohoes: | 42.8 |
| Halfmoon: | 15.6 |
| Troy: | 17.2 |
| Watervliet: | 23.5 |
| Sand Lake: | 6.4 |
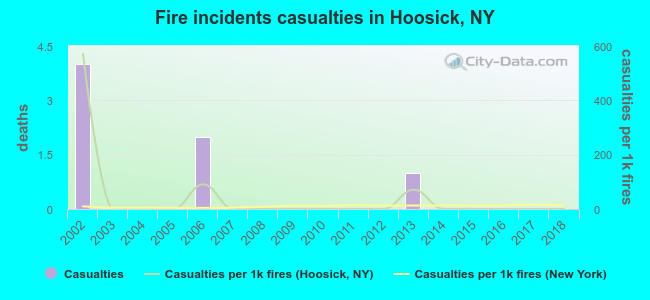 According to the data from the years 2002 - 2018 the average number of fire-related casualties per year is 0. The highest number of reported casualties - 4 took place in 2002, and the lowest - 0 in 2003. The data has a dropping trend.
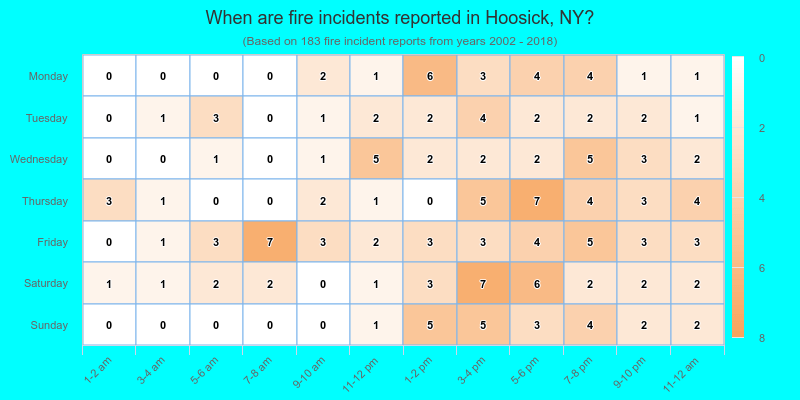
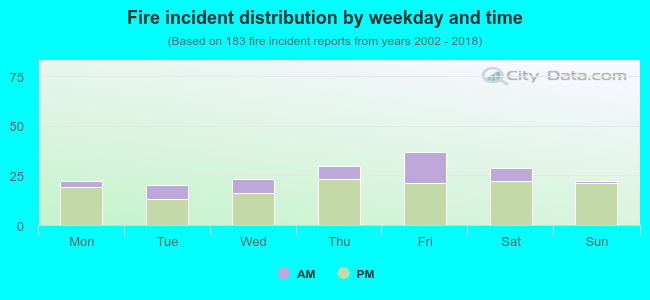 26.2% incidents where reported in the morning and 73.8% in the evening. The most fires (20.2%) took place on Friday, and the least (10.9%) on Tuesday.
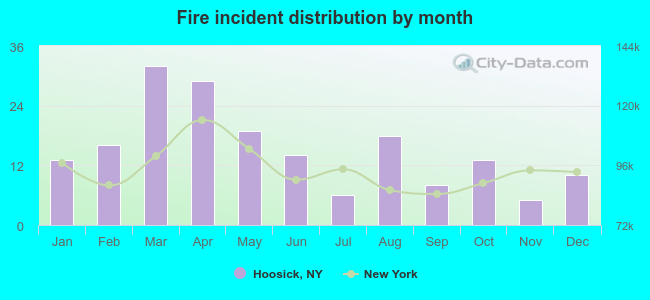 Based on the 183 fires from years 2002 - 2018 most fires (17.5%) took place during March, and the least (2.7%) in November.
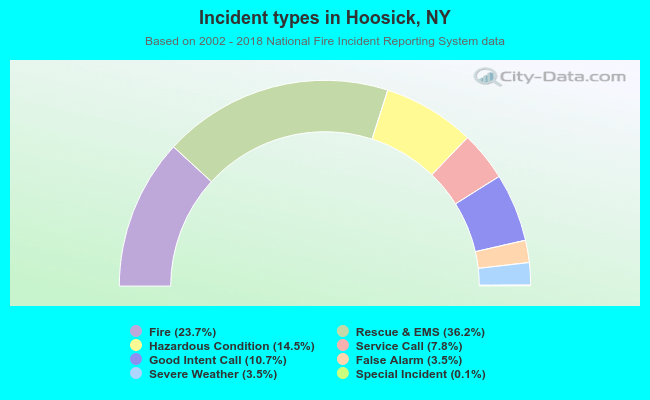 Out of all 773 cases reported during the years 2002 - 2018, the most belonged to the categories: Overpressure Rupture (36.2%), Fire (23.7%), and Rescue & EMS (14.5%).
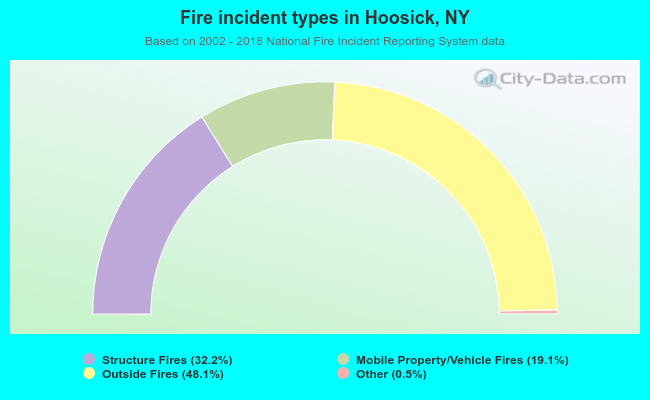 When looking into fire subcategories, the most incidents belonged to: Outside Fires (48.1%), and Structure Fires (32.2%).