Cohoes: Fire Incidents, New York (NY)
Where are fire incidents reported in Cohoes, NY
Something went wrong! Please refresh the page.
| Fire incidents reported | |
|---|---|
| Sreet name | Count |
| COLUMBIA ST | 202 |
| SARATOGA ST | 144 |
| REMSEN ST | 126 |
| MAIN ST | 102 |
| WATERSIDE WAY | 100 |
| ONTARIO ST | 96 |
| CONGRESS ST | 92 |
| MOHAWK ST | 80 |
| LANCASTER ST | 68 |
| VLIET ST | 54 |
| JAMES ST | 52 |
| NORTH MOHAWK ST | 52 |
| CENTRAL AVE | 48 |
| GARNER ST | 48 |
| WESTERN AVE | 44 |
| EUCLID ST | 42 |
| PARK AVE | 38 |
| WILLIAMS ST | 34 |
| CONTINENTAL AVE | 32 |
| WHITE ST | 32 |
| JOHNSTON AVE | 30 |
| 787 | 28 |
| EDWARD ST | 28 |
| BRIDGE AVE | 26 |
| DELAWARE AVE | 26 |
| GEORGE ST | 26 |
| MANOR AVE | 26 |
| LOUDON RD | 24 |
| OLMSTEAD ST | 24 |
| LINCOLN AVE | 22 |
2002 - 2018 National Fire Incident Reporting System (NFIRS) incidents
- Incident types reported to NFIRS in Cohoes, NY
- 12,03756.3%Rescue & EMS
- 3,56116.7%Hazardous Condition
- 1,9539.1%False Alarm
- 1,4706.9%Service Call
- 1,3526.3%Fire
- 9484.4%Good Intent Call
- 290.1%Special Incident
- Fire incident types reported to NFIRS in Cohoes, NY
- 63847.2%Structure Fires
- 51938.4%Outside Fires
- 1198.8%Mobile Property/Vehicle Fires
- 765.6%Other
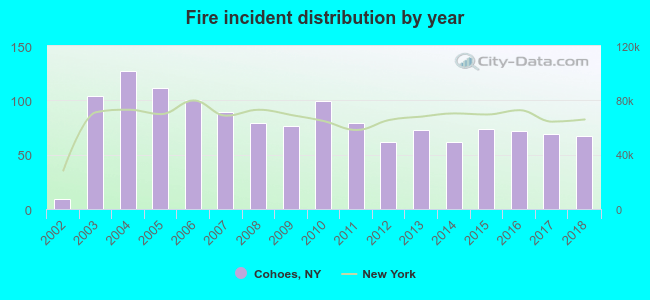 According to the data from the years 2002 - 2018 the average number of fires per year is 80. The highest number of fire incidents - 127 took place in 2004, and the least - 9 in 2002. The data has a rising trend.
The average number of yearly fire incidents per 10k residents in Cohoes, NY compared to nearest cities:
(Note: Based on data for the last 3 years, including only cities with population 5,000 and above)
| Cohoes: | 42.8 |
| Troy: | 17.2 |
| Watervliet: | 23.5 |
| Brunswick: | 4.2 |
| Halfmoon: | 15.6 |
| Colonie: | 120.5 |
| Clifton Park: | 34.1 |
| Albany: | 50.8 |
| Rensselaer: | 136.6 |
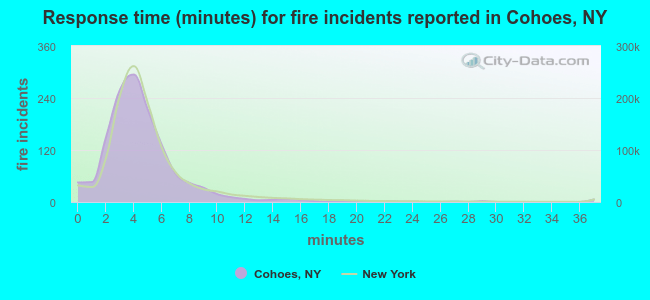 The median response time based on all reported fire incidents is 4 minutes. This is close to the New York median value.
The median response time in Cohoes, NY compared to nearest cities:
(Note: Based on data for all years, including only cities with at least 500 fire incidents)
| Cohoes: | 4 minutes |
| Waterford: | 5 minutes |
| Troy: | 7 minutes |
| Halfmoon: | 6 minutes |
| Wynantskill: | 8 minutes |
| Colonie: | 7 minutes |
| Clifton Park: | 6 minutes |
| Albany: | 5 minutes |
| Rensselaer: | 4 minutes |
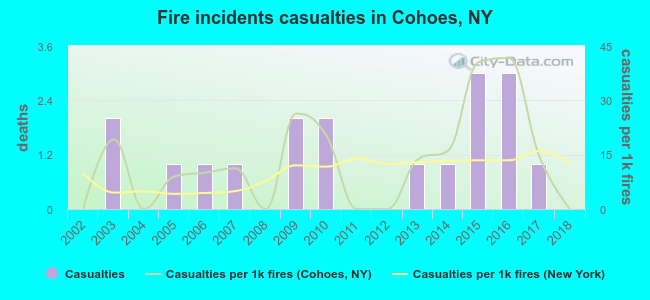 Based on the data from the years 2002 - 2018 the average number of fire-related yearly casualties is 1. The highest number of injuries - 3 took place in 2015, and the lowest - 0 in 2002. The data has a constant trend.
The average number of injuries per 1,000 fires is 13. This indicator was the highest - 42 in 2016, and the lowest 0 in 2002. The trend for casualties per 1,000 incidents is constant. Compared to the state value the number of casualties per 1,000 fire incidents is higher.
Based on the data from the years 2002 - 2018 the average number of fire-related yearly casualties is 1. The highest number of injuries - 3 took place in 2015, and the lowest - 0 in 2002. The data has a constant trend.
The average number of injuries per 1,000 fires is 13. This indicator was the highest - 42 in 2016, and the lowest 0 in 2002. The trend for casualties per 1,000 incidents is constant. Compared to the state value the number of casualties per 1,000 fire incidents is higher.Casualties per 1,000 incidents in Cohoes, NY compared to nearest cities:
(Note: Based on data for all years, including only cities with at least 500 fire incidents)
| Cohoes: | 13.3 |
| Waterford: | 4.6 |
| Troy: | 6.3 |
| Halfmoon: | 6.8 |
| Wynantskill: | 5.4 |
| Colonie: | 2.6 |
| Clifton Park: | 6.7 |
| Albany: | 15.6 |
| Rensselaer: | 7.9 |
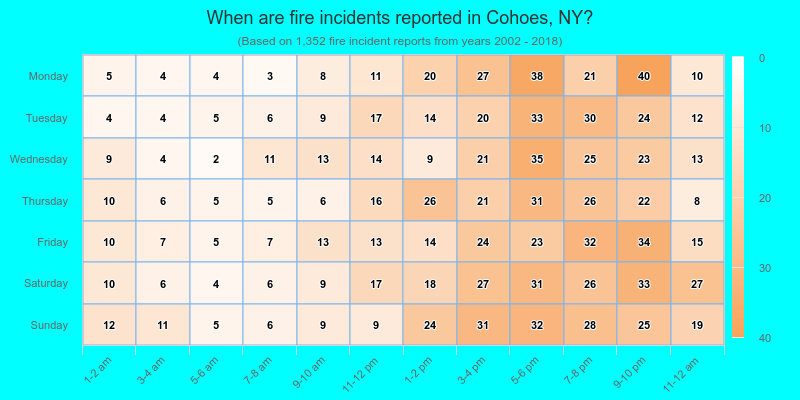
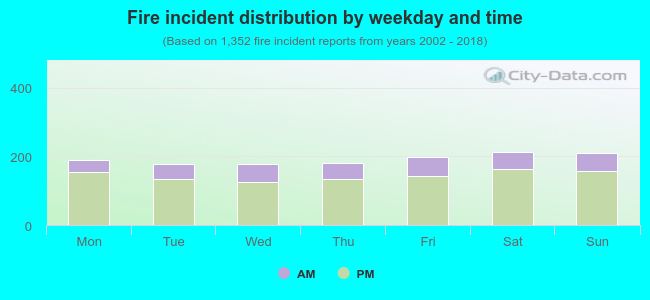 25.1% incidents where reported in the morning and 74.9% in the evening. The most fires (15.8%) took place on Saturday, and the least (13.2%) on Tuesday.
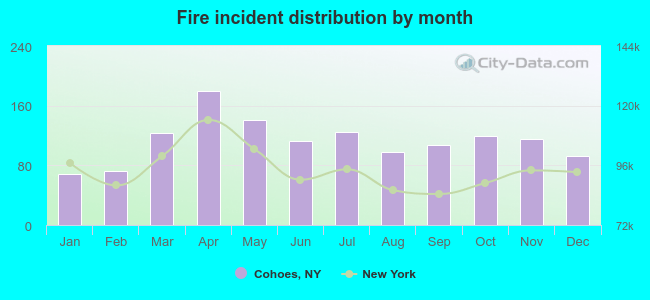 Based on the 1,352 fire incident reports from years 2002 - 2018 most fires (13.2%) took place during April, and the least (5.0%) in January.
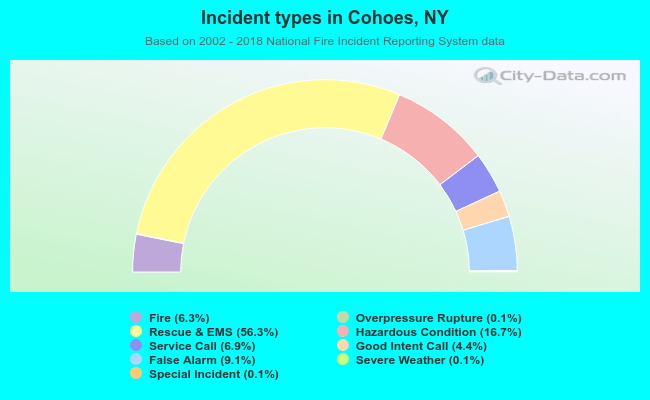 Out of all 21,381 cases reported during the years 2002 - 2018, the most belonged to the categories: Rescue & EMS (56.3%), Hazardous Condition (16.7%), and False Alarm (9.1%).
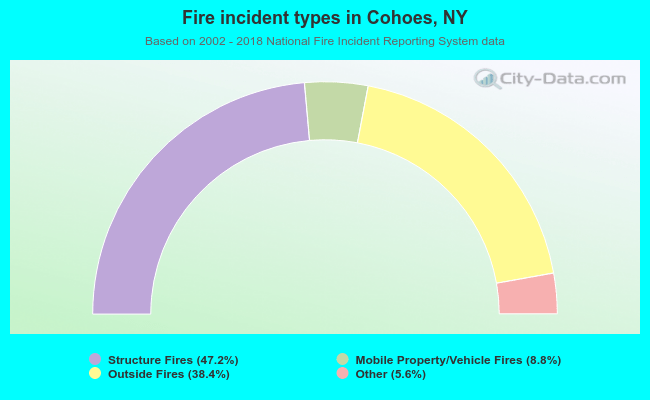 When looking into fire subcategories, the most incidents belonged to: Structure Fires (47.2%), and Outside Fires (38.4%).