Hope Mills: Fire Incidents, North Carolina (NC)
Where are fire incidents reported in Hope Mills, NC
Something went wrong! Please refresh the page.
| Fire incidents reported | |
|---|---|
| Sreet name | Count |
| MAIN ST | 404 |
| LEGION RD | 182 |
| CHICKEN FOOT RD | 172 |
| ELK RD | 166 |
| HOPE MILLS RD | 140 |
| MUSCAT RD | 130 |
| PARKTON RD | 130 |
| CAMDEN RD | 118 |
| HWY 301 HWY | 108 |
| LEXINGTON DR | 96 |
| BRAXTON RD | 94 |
| I 95 | 94 |
| ROCKFISH RD | 82 |
| CUMBERLAND RD | 76 |
| CAMERON RD | 74 |
| SAND HILL RD | 74 |
| TOM STARLING RD | 74 |
| CANADIAN AVE | 72 |
| DUNROBIN DR | 66 |
| MONTICELLO AVE | 64 |
| BRISSON RD | 60 |
| CALHOUN DR | 60 |
| JOHN MCMILLAN RD | 60 |
| BIG PINE DR | 58 |
| CYPRESS LAKES RD | 58 |
| GOLFVIEW RD | 58 |
| SANDHILL RD | 54 |
| CANADY POND RD | 52 |
| JACKSON ST | 50 |
| PERMASTONE LAKE RD | 48 |
| Other | 2,526 |
2002 - 2018 National Fire Incident Reporting System (NFIRS) incidents
- Incident types reported to NFIRS in Hope Mills, NC
- 9,98941.8%Rescue & EMS
- 5,50023.0%Fire
- 4,45618.7%Good Intent Call
- 1,6286.8%False Alarm
- 1,1274.7%Service Call
- 1,1194.7%Hazardous Condition
- 370.2%Severe Weather
- Fire incident types reported to NFIRS in Hope Mills, NC
- 3,01054.7%Structure Fires
- 1,87834.1%Outside Fires
- 3786.9%Mobile Property/Vehicle Fires
- 2344.3%Other
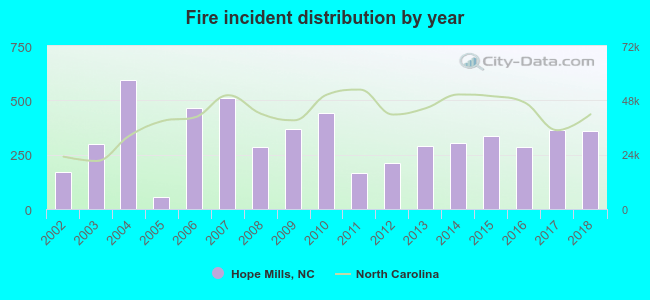 Based on the data from the years 2002 - 2018 the average number of fires per year is 324. The highest number of reported fire incidents - 594 took place in 2004, and the least - 57 in 2005. The data has a growing trend.
The average number of yearly fire incidents per 10k residents in Hope Mills, NC compared to nearest cities:
(Note: Based on data for the last 3 years, including only cities with population 5,000 and above)
| Hope Mills: | 205.7 |
| Fayetteville: | 65.8 |
| Fort Bragg: | 0.3 |
| Spring Lake: | 144.1 |
| Lumberton: | 156.6 |
| Southern Pines: | 88.4 |
| Aberdeen: | 178.1 |
| Dunn: | 217.0 |
| Laurinburg: | 99.6 |
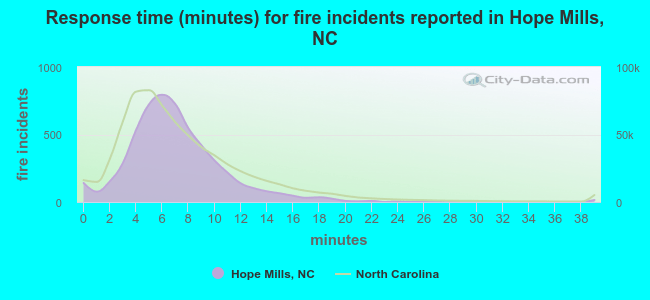 The median response time based on all reported fire incidents is 7 minutes. This is comparable to the North Carolina median value.
The median response time in Hope Mills, NC compared to nearest cities:
(Note: Based on data for all years, including only cities with at least 500 fire incidents)
| Hope Mills: | 7 minutes |
| Parkton: | 9 minutes |
| Fayetteville: | 5 minutes |
| Lumber Bridge: | 10 minutes |
| Shannon: | 10 minutes |
| Spring Lake: | 8 minutes |
| Stedman: | 9 minutes |
| Raeford: | 8 minutes |
| Red Springs: | 9 minutes |
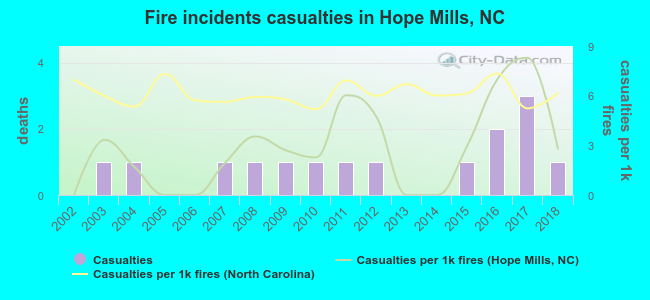 According to the data from the years 2002 - 2018 the average number of fire-related yearly casualties is 1. The highest number of reported injuries - 3 took place in 2017, and the lowest - 0 in 2002. The data has a rising trend.
The average number of casualties per 1,000 fires is 3. This indicator was the highest - 8 in 2017, and the lowest 0 in 2002. The trend for casualties per 1,000 fires is rising. Compared to the state value the number of casualties per 1,000 incidents is much lower.
According to the data from the years 2002 - 2018 the average number of fire-related yearly casualties is 1. The highest number of reported injuries - 3 took place in 2017, and the lowest - 0 in 2002. The data has a rising trend.
The average number of casualties per 1,000 fires is 3. This indicator was the highest - 8 in 2017, and the lowest 0 in 2002. The trend for casualties per 1,000 fires is rising. Compared to the state value the number of casualties per 1,000 incidents is much lower.Casualties per 1,000 incidents in Hope Mills, NC compared to nearest cities:
(Note: Based on data for all years, including only cities with at least 500 fire incidents)
| Hope Mills: | 2.7 |
| Parkton: | 0.8 |
| Fayetteville: | 13.9 |
| Lumber Bridge: | 1.6 |
| Shannon: | 0.0 |
| Spring Lake: | 1.1 |
| Stedman: | 0.9 |
| Raeford: | 1.8 |
| Red Springs: | 1.3 |
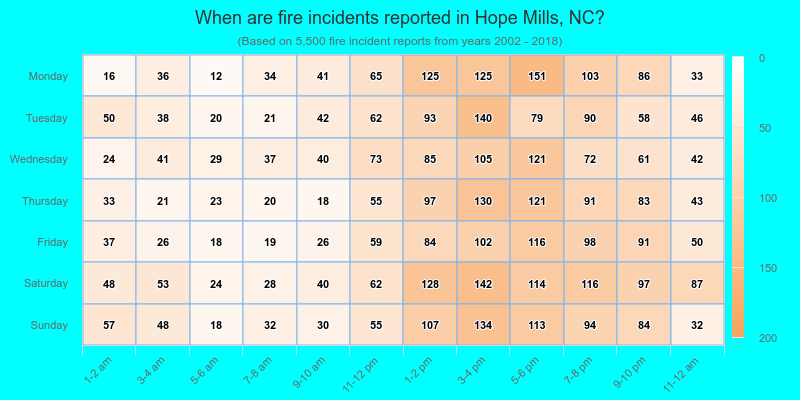
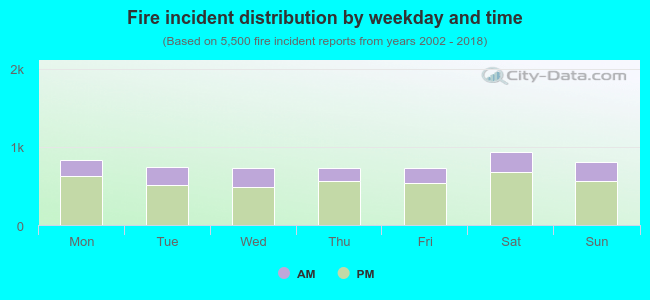 27.8% incidents where reported in the morning and 72.2% in the evening. The most fires (17.1%) took place on Saturday, and the least (13.2%) on Friday.
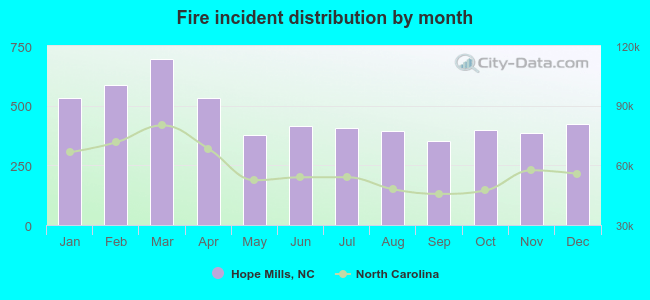 According to the 5,500 fire incident reports from years 2002 - 2018 most fires (12.7%) took place during March, and the least (6.4%) in September.
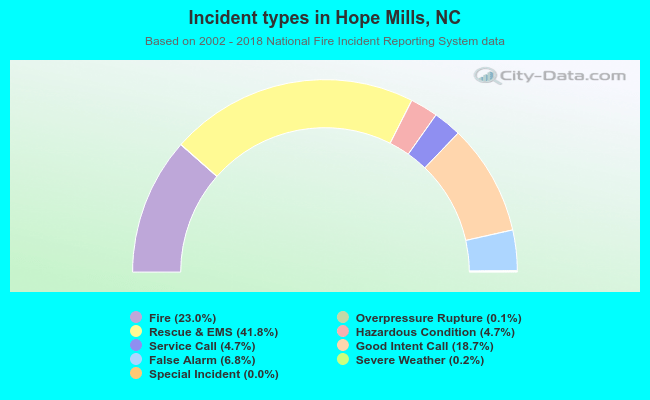 Out of all 23,882 cases reported during the years 2002 - 2018, the most belonged to the categories: Rescue & EMS (41.8%), Fire (23.0%), and Good Intent Call (18.7%).
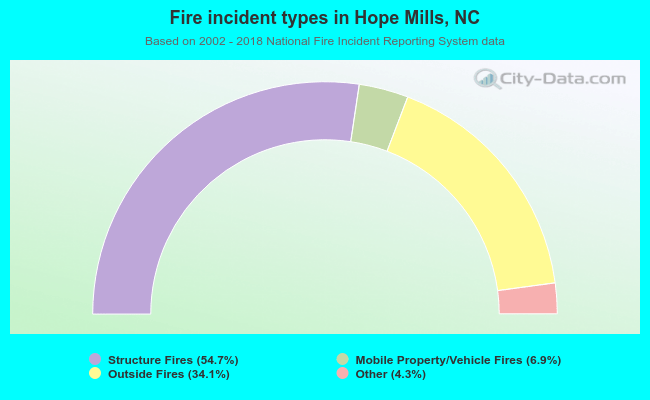 When looking into fire subcategories, the most reports belonged to: Structure Fires (54.7%), and Outside Fires (34.1%).