Hoquiam: Fire Incidents, Washington (WA)
Where are fire incidents reported in Hoquiam, WA
Something went wrong! Please refresh the page.
| Fire incidents reported | |
|---|---|
| Sreet name | Count |
| SIMPSON AVE | 152 |
| SUMNER AVE | 100 |
| LINCOLN ST | 58 |
| QUEETS AVE | 58 |
| 8TH ST | 56 |
| BROADWAY AVE | 56 |
| EMERSON AVE | 56 |
| 23RD ST | 52 |
| EKLUND AVE | 48 |
| US 101 HWY | 48 |
| CHERRY ST | 44 |
| HOQUIAM RD | 44 |
| PACIFIC AVE | 44 |
| ABERDEEN AVE | 42 |
| KARR AVE | 42 |
| K ST | 38 |
| CHENAULT AVE | 36 |
| QUEEN AVE | 32 |
| JOHN STEVENS WAY WAY | 30 |
| ENDRESEN RD | 28 |
| 7TH ST | 22 |
| L ST | 22 |
| ONTARIO STREET ST | 22 |
| 2ND ST | 20 |
| BAY AVE | 20 |
| MONROE ST | 20 |
| 109 BYPASS | 18 |
| 3RD ST | 18 |
| 5TH ST | 18 |
| ADAMS ST | 18 |
2002 - 2018 National Fire Incident Reporting System (NFIRS) incidents
- Incident types reported to NFIRS in Hoquiam, WA
- 2,35254.1%Rescue & EMS
- 1,01223.3%Fire
- 2355.4%Service Call
- 2355.4%Good Intent Call
- 2124.9%Hazardous Condition
- 2024.6%False Alarm
- 922.1%Special Incident
- 90.2%Overpressure Rupture
- Fire incident types reported to NFIRS in Hoquiam, WA
- 43743.2%Structure Fires
- 34033.6%Outside Fires
- 12612.5%Mobile Property/Vehicle Fires
- 10910.8%Other
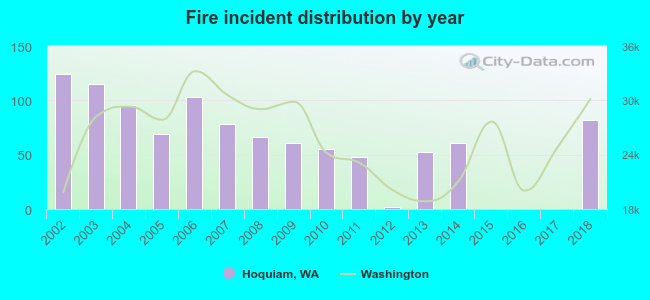 Based on the data from the years 2002 - 2018 the average number of fires per year is 60. The highest number of reported fire incidents - 124 took place in 2002, and the least - 0 in 2015. The data has a decreasing trend.
The average number of yearly fire incidents per 10k residents in Hoquiam, WA compared to nearest cities:
(Note: Based on data for the last 3 years, including only cities with population 5,000 and above)
| Hoquiam: | 97.7 |
| Aberdeen: | 58.2 |
| Ocean Shores: | 14.2 |
| Olympic: | 1.6 |
| Shelton: | 368.9 |
| Tumwater: | 58.6 |
| Olympia: | 118.4 |
| Centralia: | 104.3 |
| Chehalis: | 282.8 |
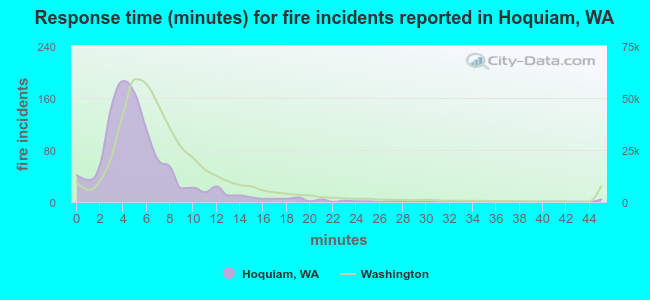 The median response time based on all reported fire incidents is 5 minutes. This is lower than the Washington median value.
The median response time in Hoquiam, WA compared to nearest cities:
(Note: Based on data for all years, including only cities with at least 500 fire incidents)
| Hoquiam: | 5 minutes |
| Aberdeen: | 5 minutes |
| Westport: | 9 minutes |
| Ocean Shores: | 6 minutes |
| Montesano: | 9 minutes |
| Raymond: | 4 minutes |
| Elma: | 10 minutes |
| Ocean Park: | 6 minutes |
| Rochester: | 9 minutes |
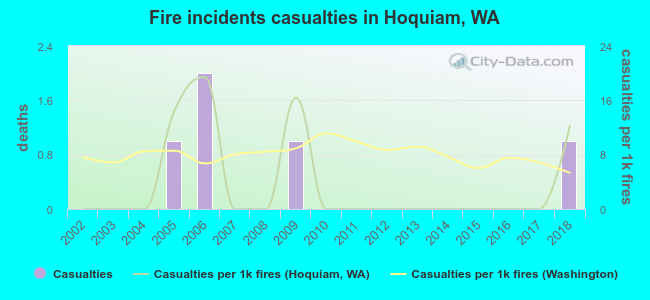 According to the data from the years 2002 - 2018 the average number of fire-related casualties per year is 0. The highest number of injuries - 2 took place in 2006, and the lowest - 0 in 2002. The data has a rising trend.
The average number of injuries per 1,000 fire incidents is 4. This indicator was the highest - 19 in 2006, and the lowest 0 in 2002. The trend for injuries per 1,000 fire incidents is rising. Compared to the Washington value the number of casualties per 1,000 fire incidents is lower.
According to the data from the years 2002 - 2018 the average number of fire-related casualties per year is 0. The highest number of injuries - 2 took place in 2006, and the lowest - 0 in 2002. The data has a rising trend.
The average number of injuries per 1,000 fire incidents is 4. This indicator was the highest - 19 in 2006, and the lowest 0 in 2002. The trend for injuries per 1,000 fire incidents is rising. Compared to the Washington value the number of casualties per 1,000 fire incidents is lower.Casualties per 1,000 incidents in Hoquiam, WA compared to nearest cities:
(Note: Based on data for all years, including only cities with at least 500 fire incidents)
| Hoquiam: | 4.9 |
| Aberdeen: | 12.0 |
| Westport: | 0.0 |
| Ocean Shores: | 1.5 |
| Montesano: | 10.5 |
| Raymond: | 14.7 |
| Elma: | 0.0 |
| Ocean Park: | 15.9 |
| Rochester: | 1.7 |
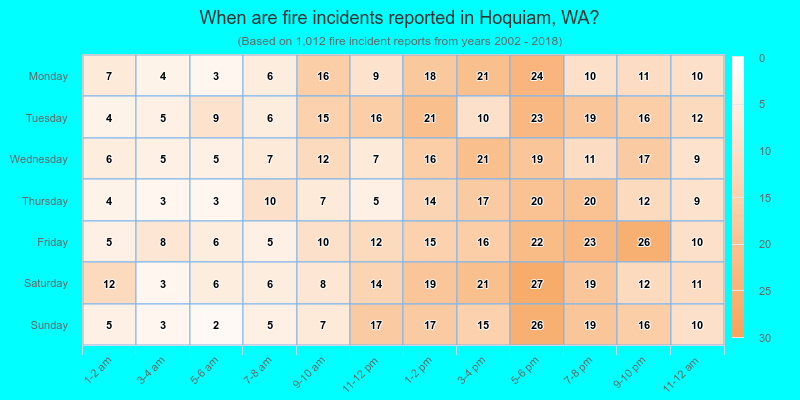
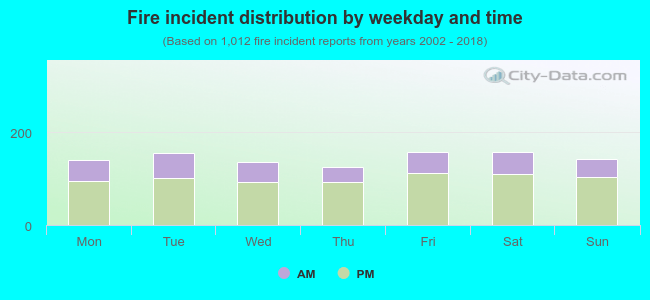 30.4% incidents where reported in the morning and 69.6% in the evening. The most fires (15.6%) took place on Friday, and the least (12.3%) on Thursday.
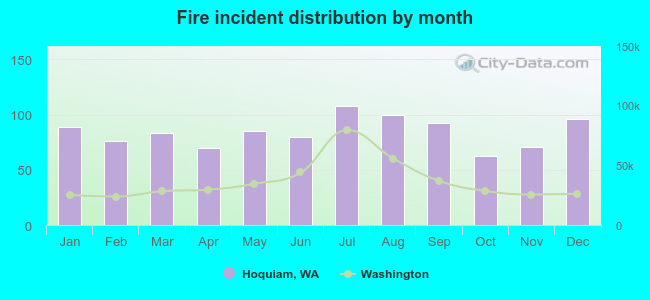 According to the 1,012 reports from years 2002 - 2018 most fires (10.7%) took place during July, and the least (6.1%) in October.
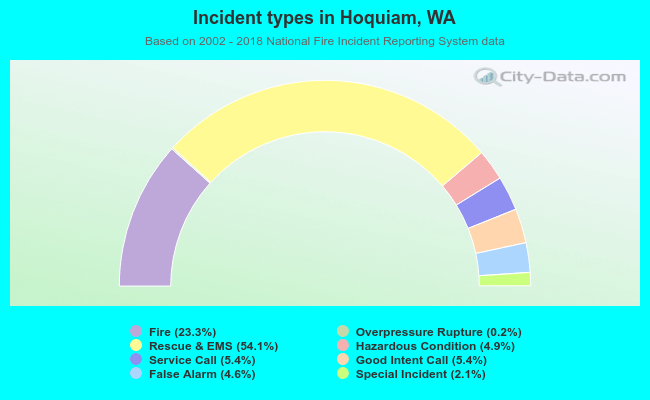 Out of all 4,349 cases reported during the years 2002 - 2018, the most belonged to the categories: Rescue & EMS (54.1%), Fire (23.3%), and Service Call (5.4%).
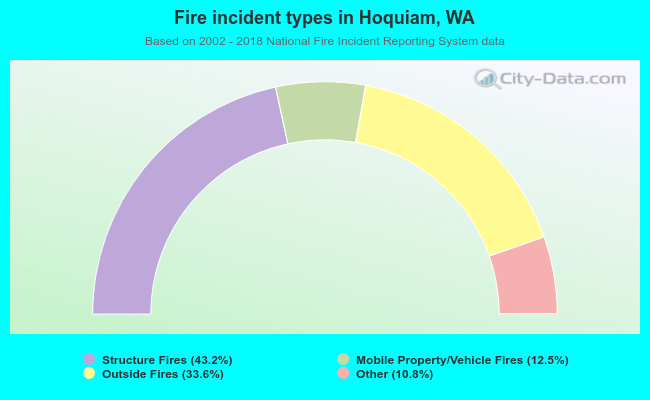 When looking into fire subcategories, the most reports belonged to: Structure Fires (43.2%), and Outside Fires (33.6%).