Imperial: Fire Incidents, Missouri (MO)
Where are fire incidents reported in Imperial, MO
Something went wrong! Please refresh the page.
| Fire incidents reported | |
|---|---|
| Sreet name | Count |
| OLD STATE RT 21 | 52 |
| I-55 (MAIN TO HWY "M") | 32 |
| I-55 RICHARDSON TO MAIN | 22 |
| INTERSTATE 55 | 22 |
| MAIN STREET-AKA-IMPERIAL | 22 |
| OLD LEMAY FERRY RD | 22 |
| WOLF HOLLOW ROAD | 22 |
| I- 55 (HIGHWAY "M" SOUTH) | 20 |
| INTERSTATE 55 ("M' SOUTH) | 20 |
| ROCK CREEK RD | 18 |
| SECKMAN RD | 18 |
| SECKMAN RD. | 18 |
| TREEBROOK DR | 18 |
| FOUR RIDGE RD | 16 |
| I- 55 | 16 |
| OLD LEMAY FERRY | 16 |
| WEST ROCK CREEK RD | 16 |
| HIGHWAY "M" | 14 |
| MAIN ST | 14 |
| MONTEBELLO ROAD | 14 |
| MORGAN WAY | 14 |
| ROMAINE CREEK RD | 14 |
| US HWY 61-67 | 14 |
| CEDARGATE WAY | 12 |
| COUNTRY CLUB DR | 12 |
| HIGHWAY 61-67 (6000-7017) | 12 |
| LIONS DEN RD | 12 |
| OLD LEMAY FERRY RD. | 12 |
| OLD STATE ROAD | 12 |
| OLD STATE ROUTE 21 | 12 |
| Other | 1,213 |
2002 - 2018 National Fire Incident Reporting System (NFIRS) incidents
- Incident types reported to NFIRS in Imperial, MO
- 3,12843.1%Rescue & EMS
- 1,75124.1%Fire
- 79010.9%Good Intent Call
- 72510.0%Hazardous Condition
- 4786.6%Service Call
- 3574.9%False Alarm
- 130.2%Special Incident
- 80.1%Overpressure Rupture
- Fire incident types reported to NFIRS in Imperial, MO
- 67038.3%Structure Fires
- 64636.9%Outside Fires
- 29917.1%Mobile Property/Vehicle Fires
- 1367.8%Other
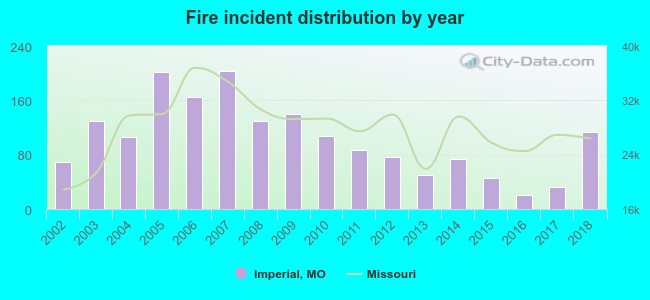 Based on the data from the years 2002 - 2018 the average number of fire incidents per year is 103. The highest number of fire incidents - 203 took place in 2007, and the least - 21 in 2016. The data has an increasing trend.
 The median response time based on all reported fire incidents is 7 minutes. This is about the same as the Missouri median value.
The median response time in Imperial, MO compared to nearest cities:
(Note: Based on data for all years, including only cities with at least 500 fire incidents)
| Imperial: | 7 minutes |
| Barnhart: | 8 minutes |
| Arnold: | 6 minutes |
| Pevely: | 6 minutes |
| Columbia: | 8 minutes |
| Festus: | 9 minutes |
| High Ridge: | 6 minutes |
| Sunset Hills: | 5 minutes |
| Fenton: | 6 minutes |
 According to the data from the years 2002 - 2018 the average number of fire-related casualties per year is 0. The highest number of injuries - 2 took place in 2009, and the lowest - 0 in 2002. The data has a constant trend.
The average number of casualties per 1,000 fire incidents is 2. This indicator was the highest - 14 in 2009, and the lowest 0 in 2002. The trend for injuries per 1,000 fire incidents is constant. Compared to the Missouri value the number of injuries per 1,000 fires is much lower.
According to the data from the years 2002 - 2018 the average number of fire-related casualties per year is 0. The highest number of injuries - 2 took place in 2009, and the lowest - 0 in 2002. The data has a constant trend.
The average number of casualties per 1,000 fire incidents is 2. This indicator was the highest - 14 in 2009, and the lowest 0 in 2002. The trend for injuries per 1,000 fire incidents is constant. Compared to the Missouri value the number of injuries per 1,000 fires is much lower.Casualties per 1,000 incidents in Imperial, MO compared to nearest cities:
(Note: Based on data for all years, including only cities with at least 500 fire incidents)
| Imperial: | 2.9 |
| Barnhart: | 0.0 |
| Arnold: | 4.5 |
| Pevely: | 3.5 |
| Columbia: | 0.0 |
| Festus: | 2.0 |
| High Ridge: | 6.3 |
| Sunset Hills: | 3.4 |
| Fenton: | 2.4 |
 30.6% incidents where reported in the morning and 69.4% in the evening. The most fires (16.8%) took place on Sunday, and the least (11.4%) on Monday.
 Based on the 1,751 fire incidents from years 2002 - 2018 most fires (11.7%) took place during April, and the least (5.5%) in August.
 Out of all 7,253 cases reported during the years 2002 - 2018, the most belonged to the categories: Rescue & EMS (43.1%), Fire (24.1%), and Good Intent Call (10.9%).
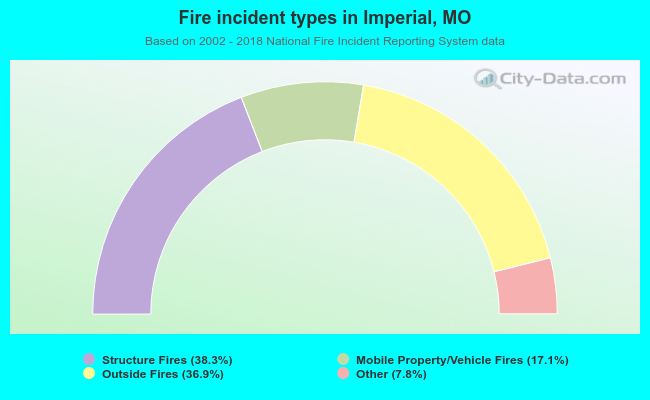 When looking into fire subcategories, the most reports belonged to: Structure Fires (38.3%), and Outside Fires (36.9%).