Sunset Hills: Fire Incidents, Missouri (MO)
Where are fire incidents reported in Sunset Hills, MO
Something went wrong! Please refresh the page.
|
| |||||||||||||||||||||||||||||||||||||||||||||||||||||||||||||||||||||||||||||||||||||||||||||||||||||||||||||
2002 - 2018 National Fire Incident Reporting System (NFIRS) incidents
- Incident types reported to NFIRS in Sunset Hills, MO
- 4,24368.5%Rescue & EMS
- 5939.6%Fire
- 4196.8%False Alarm
- 3706.0%Hazardous Condition
- 3615.8%Good Intent Call
- 1973.2%Service Call
- 70.1%Overpressure Rupture
- Fire incident types reported to NFIRS in Sunset Hills, MO
- 20234.1%Structure Fires
- 17729.8%Mobile Property/Vehicle Fires
- 17529.5%Outside Fires
- 396.6%Other
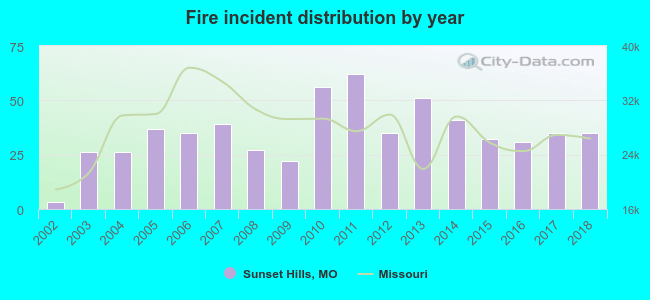 According to the data from the years 2002 - 2018 the average number of fire incidents per year is 35. The highest number of fires - 62 took place in 2011, and the least - 3 in 2002. The data has a growing trend.
The average number of yearly fire incidents per 10k residents in Sunset Hills, MO compared to nearest cities:
(Note: Based on data for the last 3 years, including only cities with population 5,000 and above)
| Sunset Hills: | 39.5 |
| Crestwood: | 22.6 |
| Kirkwood: | 26.6 |
| Glendale: | 11.3 |
| Affton: | 8.9 |
| Webster Groves: | 24.9 |
| Valley Park: | 33.4 |
| Des Peres: | 19.9 |
| Mehlville: | 1.2 |
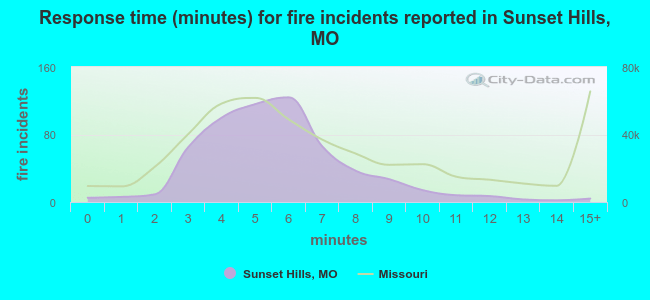 The median response time based on all reported fire incidents is 5 minutes. This is lower compared to the Missouri median value.
The median response time in Sunset Hills, MO compared to nearest cities:
(Note: Based on data for all years, including only cities with at least 500 fire incidents)
| Sunset Hills: | 5 minutes |
| Crestwood: | 4 minutes |
| Fenton: | 6 minutes |
| Kirkwood: | 5 minutes |
| Affton: | 5 minutes |
| Webster Groves: | 5 minutes |
| Valley Park: | 6 minutes |
| Shrewsbury: | 5 minutes |
| Lemay: | 6 minutes |
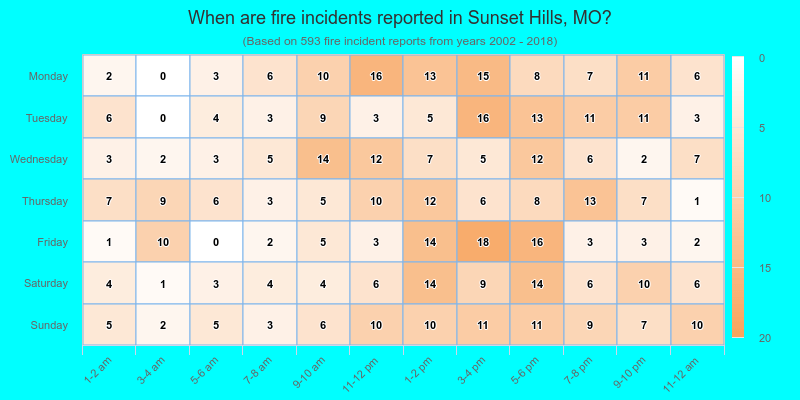
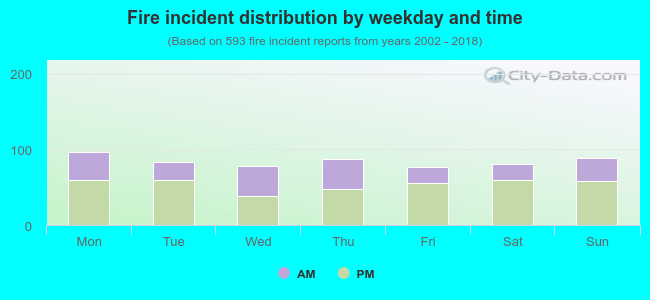 36.3% incidents where reported in the morning and 63.7% in the evening. The most fires (16.4%) took place on Monday, and the least (13.0%) on Friday.
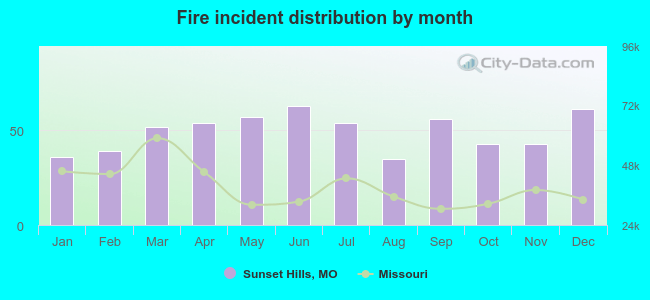 Based on the 593 fire incident reports from years 2002 - 2018 most fires (10.6%) took place during June, and the least (5.9%) in August.
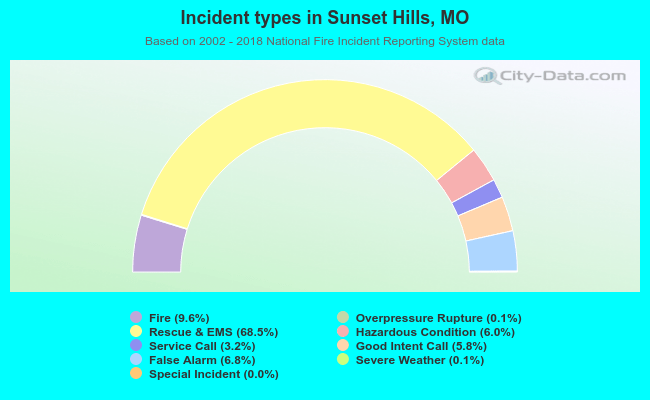 Out of all 6,197 cases reported during the years 2002 - 2018, the most belonged to the categories: Rescue & EMS (68.5%), Fire (9.6%), and False Alarm (6.8%).
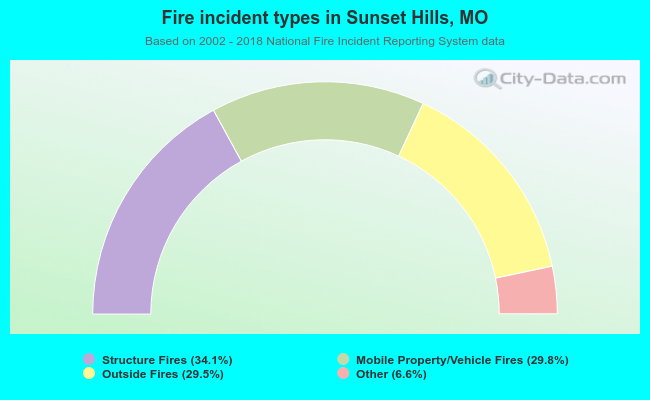 When looking into fire subcategories, the most incidents belonged to: Structure Fires (34.1%), and Mobile Property/Vehicle Fires (29.8%).