Inglewood: Fire Incidents, California (CA)
Where are fire incidents reported in Inglewood, CA
Something went wrong! Please refresh the page.
| Fire incidents reported | |
|---|---|
| Sreet name | Count |
| CENTURY | 292 |
| MANCHESTER | 252 |
| CRENSHAW | 230 |
| LA BREA | 172 |
| PRAIRIE | 132 |
| HYDE PARK | 122 |
| IMPERIAL | 122 |
| ARBOR VITAE | 104 |
| INGLEWOOD | 102 |
| 102ND | 98 |
| BEACH | 90 |
| CENTINELA | 86 |
| MARKET | 86 |
| FLORENCE | 84 |
| LOCUST | 82 |
| OSAGE | 78 |
| EUCALYPTUS | 76 |
| QUEEN | 74 |
| REGENT | 70 |
| 104TH | 68 |
| LA CIENEGA | 66 |
| KELSO | 64 |
| FLOWER | 62 |
| HILLCREST | 58 |
| VENICE | 58 |
| GREVILLEA | 56 |
| HARDY | 54 |
| 64TH | 52 |
| 99TH | 52 |
| BUCKTHORN | 50 |
2005 - 2018 National Fire Incident Reporting System (NFIRS) incidents
- Incident types reported to NFIRS in Inglewood, CA
- 40,23667.0%Rescue & EMS
- 11,38219.0%Good Intent Call
- 2,7244.5%Fire
- 2,6774.5%False Alarm
- 1,4812.5%Service Call
- 1,4462.4%Hazardous Condition
- 660.1%Special Incident
- Fire incident types reported to NFIRS in Inglewood, CA
- 94834.8%Outside Fires
- 87632.2%Structure Fires
- 64923.8%Mobile Property/Vehicle Fires
- 2519.2%Other
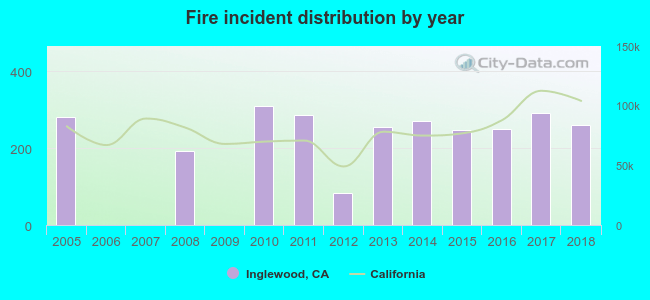 According to the data from the years 2005 - 2018 the average number of fire incidents per year is 195. The highest number of reported fire incidents - 310 took place in 2010, and the least - 0 in 2006. The data has a declining trend.
The average number of yearly fire incidents per 10k residents in Inglewood, CA compared to nearest cities:
(Note: Based on data for the last 3 years, including only cities with population 5,000 and above)
| Inglewood: | 23.8 |
| Lennox: | 13.5 |
| Ladera Heights: | 17.4 |
| Hawthorne: | 18.5 |
| El Segundo: | 31.3 |
| Culver City: | 17.9 |
| Lawndale: | 14.3 |
| Gardena: | 27.7 |
| Manhattan Beach: | 13.8 |
 The median response time based on all reported fire incidents is 4 minutes. This is lower compared to the state median value.
The median response time in Inglewood, CA compared to nearest cities:
(Note: Based on data for all years, including only cities with at least 500 fire incidents)
| Inglewood: | 4 minutes |
| Hawthorne: | 4 minutes |
| El Segundo: | 5 minutes |
| Culver City: | 6 minutes |
| Gardena: | 5 minutes |
| Manhattan Beach: | 5 minutes |
| Hermosa Beach: | 5 minutes |
| Redondo Beach: | 5 minutes |
| Huntington Park: | 4 minutes |
 35.9% incidents where reported in the morning and 64.1% in the evening. The most fires (16.0%) took place on Monday, and the least (12.8%) on Wednesday.
 According to the 2,724 fires from years 2005 - 2018 most fires (14.7%) took place during January, and the least (6.0%) in December.
 Out of all 60,038 cases reported during the years 2005 - 2018, the most belonged to the categories: Rescue & EMS (67.0%), Good Intent Call (19.0%), and Fire (4.5%).
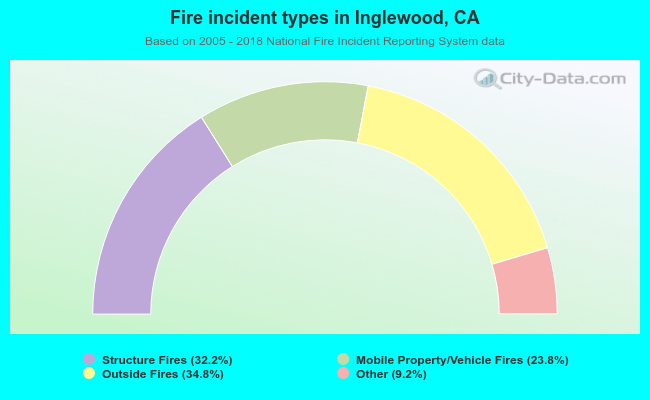 When looking into fire subcategories, the most incidents belonged to: Outside Fires (34.8%), and Structure Fires (32.2%).