Redondo Beach: Fire Incidents, California (CA)
Where are fire incidents reported in Redondo Beach, CA
Something went wrong! Please refresh the page.
| Fire incidents reported | |
|---|---|
| Sreet name | Count |
| ESPLANADE | 74 |
| PACIFIC COAST HWY | 68 |
| BERYL ST | 56 |
| HARBOR DR | 50 |
| ARTESIA | 48 |
| BROADWAY | 48 |
| ARTESIA BL | 42 |
| CATALINA AV | 40 |
| HAWTHORNE | 38 |
| 190TH ST | 34 |
| PACIFIC COAST HY | 32 |
| HUNTINGTON LN | 28 |
| PROSPECT AV | 28 |
| VANDERBILT LN | 28 |
| CATALINA AVE | 26 |
| GRANT AV | 26 |
| PROSPECT AVE | 26 |
| AVENUE G | 24 |
| THE VILLAGE | 22 |
| AVIATION | 20 |
| CATALINA | 20 |
| FLAGLER LN | 20 |
| MATHEWS | 20 |
| PROSPECT | 20 |
| SPEYER LN | 20 |
| CARNEGIE LN | 18 |
| DIAMOND ST | 18 |
| FISK LN | 18 |
| HAWTHORNE BL | 18 |
| MATHEWS AVE | 18 |
| Other | 315 |
2005 - 2018 National Fire Incident Reporting System (NFIRS) incidents
- Incident types reported to NFIRS in Redondo Beach, CA
- 17,60765.4%Rescue & EMS
- 2,3628.8%Hazardous Condition
- 2,0877.8%Service Call
- 1,9267.2%False Alarm
- 1,5865.9%Good Intent Call
- 1,2634.7%Fire
- 710.3%Special Incident
- Fire incident types reported to NFIRS in Redondo Beach, CA
- 70956.1%Structure Fires
- 32625.8%Outside Fires
- 15812.5%Mobile Property/Vehicle Fires
- 705.5%Other
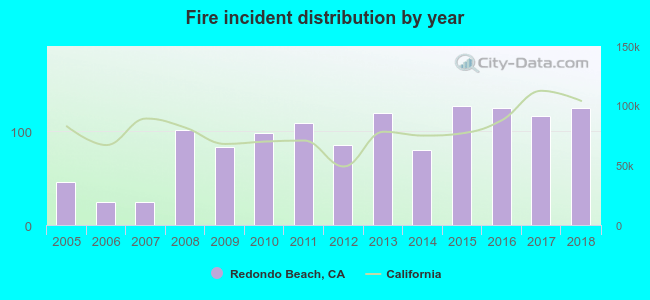 Based on the data from the years 2005 - 2018 the average number of fires per year is 90. The highest number of fires - 127 took place in 2015, and the least - 24 in 2007. The data has a rising trend.
The average number of yearly fire incidents per 10k residents in Redondo Beach, CA compared to nearest cities:
(Note: Based on data for the last 3 years, including only cities with population 5,000 and above)
| Redondo Beach: | 17.9 |
| Hermosa Beach: | 8.2 |
| Lawndale: | 14.3 |
| Torrance: | 13.1 |
| Manhattan Beach: | 13.8 |
| Hawthorne: | 18.5 |
| Gardena: | 27.7 |
| El Segundo: | 31.3 |
| Lomita: | 13.0 |
 The median response time based on all reported fire incidents is 5 minutes. This is lower than the state median value.
The median response time in Redondo Beach, CA compared to nearest cities:
(Note: Based on data for all years, including only cities with at least 500 fire incidents)
| Redondo Beach: | 5 minutes |
| Hermosa Beach: | 5 minutes |
| Torrance: | 5 minutes |
| Manhattan Beach: | 5 minutes |
| Hawthorne: | 4 minutes |
| Gardena: | 5 minutes |
| El Segundo: | 5 minutes |
| Carson: | 4 minutes |
| Inglewood: | 4 minutes |
 Based on the reports from the years 2005 - 2018 the average number of fire-related yearly casualties is 0. The highest number of casualties - 2 took place in 2012, and the lowest - 0 in 2005. The data has a constant trend.
The average number of casualties per 1,000 fire incidents is 3. This indicator was the highest - 24 in 2012, and the lowest 0 in 2005. The trend for casualties per 1,000 fire incidents is constant. Compared to the California value the number of casualties per 1,000 incidents is lower.
Based on the reports from the years 2005 - 2018 the average number of fire-related yearly casualties is 0. The highest number of casualties - 2 took place in 2012, and the lowest - 0 in 2005. The data has a constant trend.
The average number of casualties per 1,000 fire incidents is 3. This indicator was the highest - 24 in 2012, and the lowest 0 in 2005. The trend for casualties per 1,000 fire incidents is constant. Compared to the California value the number of casualties per 1,000 incidents is lower.Casualties per 1,000 incidents in Redondo Beach, CA compared to nearest cities:
(Note: Based on data for all years, including only cities with at least 500 fire incidents)
| Redondo Beach: | 3.2 |
| Hermosa Beach: | 6.1 |
| Torrance: | 4.2 |
| Manhattan Beach: | 0.0 |
| Hawthorne: | 0.5 |
| Gardena: | 1.4 |
| El Segundo: | 1.5 |
| Carson: | 1.5 |
| Inglewood: | 0.0 |
 34.3% incidents where reported in the morning and 65.7% in the evening. The most fires (16.7%) took place on Saturday, and the least (12.5%) on Friday.
 According to the 1,263 fires from years 2005 - 2018 most fires (10.0%) took place during January, and the least (6.6%) in September.
 Out of all 26,919 cases reported during the years 2005 - 2018, the most belonged to the categories: Rescue & EMS (65.4%), Hazardous Condition (8.8%), and Service Call (7.8%).
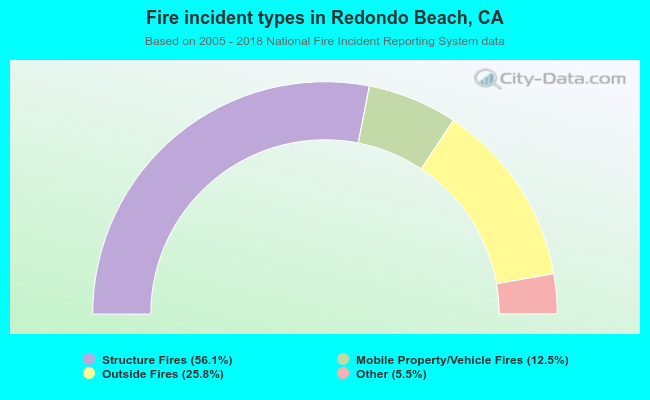 When looking into fire subcategories, the most reports belonged to: Structure Fires (56.1%), and Outside Fires (25.8%).