Issaquah: Fire Incidents, Washington (WA)
Where are fire incidents reported in Issaquah, WA
Something went wrong! Please refresh the page.
| Fire incidents reported | |
|---|---|
| Sreet name | Count |
| GILMAN BLVD | 184 |
| FRONT ST | 92 |
| NEWPORT WAY | 70 |
| LAKE SAMMAMISH PKY | 58 |
| BLACK NUGGET RD | 54 |
| 2ND AVE | 40 |
| SUNSET WAY | 38 |
| 12TH AVE | 34 |
| EB90 | 34 |
| LAKE SAMMAMISH | 34 |
| PARK DR | 34 |
| CLARK ST | 28 |
| 1ST AVE | 26 |
| DOGWOOD ST | 26 |
| 11TH AVE | 24 |
| 56TH ST | 22 |
| EAST LK | 22 |
| HIGHLANDS DR | 22 |
| JUNIPER ST | 22 |
| RAINIER BLVD | 22 |
| MOUNTAIN PARK | 20 |
| HOLLY ST | 18 |
| KLAHANIE DR | 18 |
| PROVIDENCE POINT DR | 18 |
| 10TH AVE | 16 |
| RENTON-ISSAQUAH RD | 16 |
| 15TH AVE | 14 |
| HIGH ST | 14 |
| ISSAQUAH HOBART RD | 14 |
| MAPLE ST | 14 |
| Other | 39 |
2002 - 2018 National Fire Incident Reporting System (NFIRS) incidents
- Incident types reported to NFIRS in Issaquah, WA
- 19,09272.2%Rescue & EMS
- 2,5389.6%Good Intent Call
- 2,0807.9%False Alarm
- 1,0874.1%Fire
- 9403.6%Service Call
- 6602.5%Hazardous Condition
- 360.1%Special Incident
- Fire incident types reported to NFIRS in Issaquah, WA
- 42238.8%Structure Fires
- 36533.6%Outside Fires
- 19517.9%Mobile Property/Vehicle Fires
- 1059.7%Other
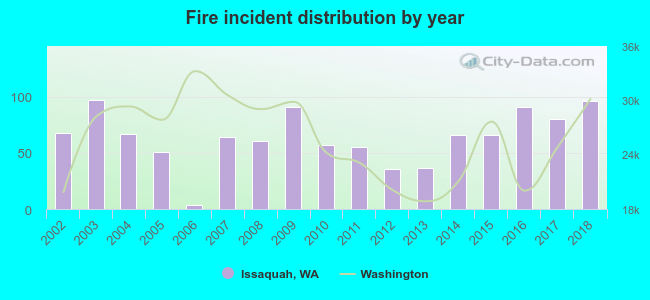 According to the data from the years 2002 - 2018 the average number of fires per year is 64. The highest number of fire incidents - 97 took place in 2003, and the least - 4 in 2006. The data has a growing trend.
The average number of yearly fire incidents per 10k residents in Issaquah, WA compared to nearest cities:
(Note: Based on data for the last 3 years, including only cities with population 5,000 and above)
| Issaquah: | 26.1 |
| Sammamish: | 11.3 |
| Newcastle: | 17.9 |
| Bellevue: | 26.4 |
| Renton: | 52.4 |
| Mercer Island: | 12.1 |
| Snoqualmie: | 10.0 |
| Redmond: | 21.2 |
| Tukwila: | 102.1 |
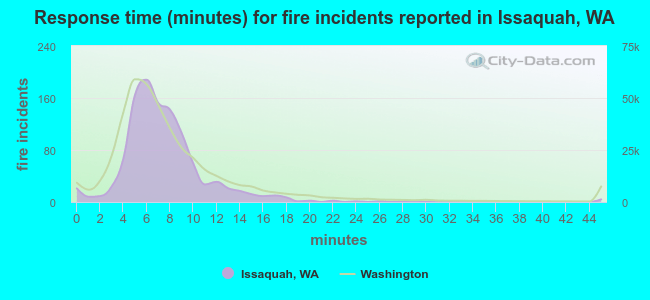 The median response time based on all reported fire incidents is 7 minutes. This is about the same as the Washington median value.
The median response time in Issaquah, WA compared to nearest cities:
(Note: Based on data for all years, including only cities with at least 500 fire incidents)
| Issaquah: | 7 minutes |
| Sammamish: | 7 minutes |
| Bellevue: | 6 minutes |
| Renton: | 6 minutes |
| Mercer Island: | 6 minutes |
| Redmond: | 6 minutes |
| Tukwila: | 6 minutes |
| Maple Valley: | 6 minutes |
| Covington: | 6 minutes |
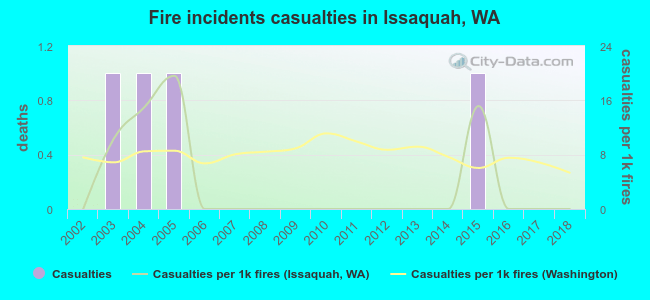 According to the data from the years 2002 - 2018 the average number of fire-related yearly casualties is 0. The highest number of reported casualties - 1 took place in 2003, and the lowest - 0 in 2002. The data has a constant trend.
The average number of casualties per 1,000 fires is 4. This indicator was the highest - 20 in 2005, and the lowest 0 in 2002. The trend for injuries per 1,000 fire incidents is constant. Compared to the state value the number of casualties per 1,000 fires is much lower.
According to the data from the years 2002 - 2018 the average number of fire-related yearly casualties is 0. The highest number of reported casualties - 1 took place in 2003, and the lowest - 0 in 2002. The data has a constant trend.
The average number of casualties per 1,000 fires is 4. This indicator was the highest - 20 in 2005, and the lowest 0 in 2002. The trend for injuries per 1,000 fire incidents is constant. Compared to the state value the number of casualties per 1,000 fires is much lower.Casualties per 1,000 incidents in Issaquah, WA compared to nearest cities:
(Note: Based on data for all years, including only cities with at least 500 fire incidents)
| Issaquah: | 3.7 |
| Sammamish: | 5.9 |
| Bellevue: | 11.9 |
| Renton: | 17.9 |
| Mercer Island: | 5.4 |
| Redmond: | 7.6 |
| Tukwila: | 15.6 |
| Maple Valley: | 3.1 |
| Covington: | 15.6 |
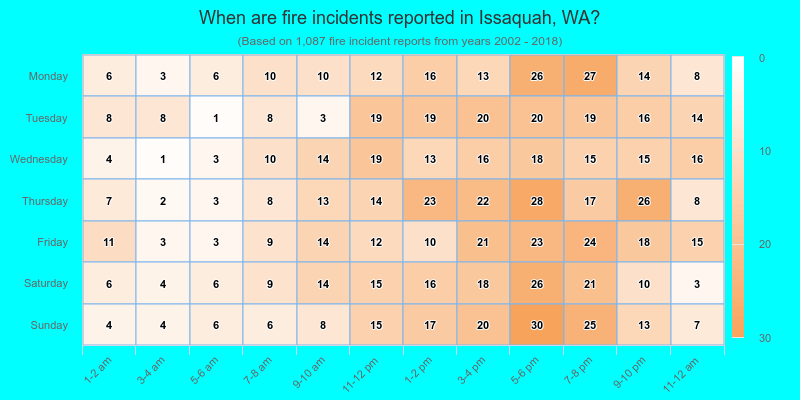
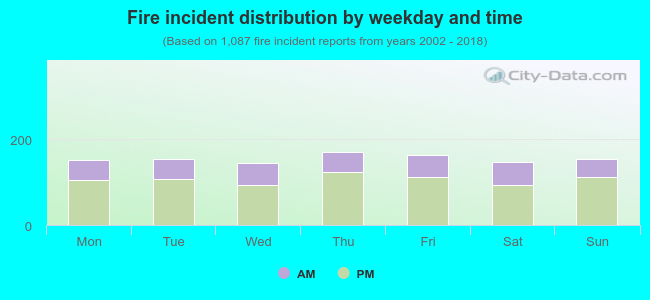 31.4% incidents where reported in the morning and 68.6% in the evening. The most fires (15.7%) took place on Thursday, and the least (13.2%) on Wednesday.
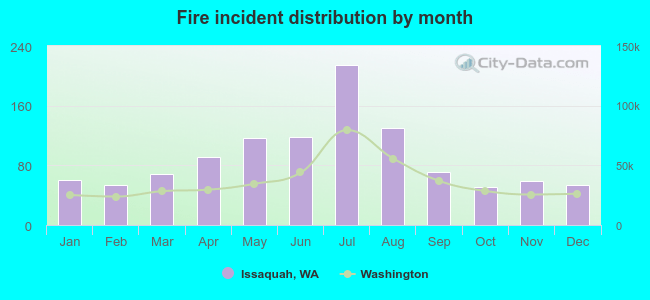 Based on the 1,087 fire incidents from years 2002 - 2018 most fires (19.8%) took place during July, and the least (4.7%) in October.
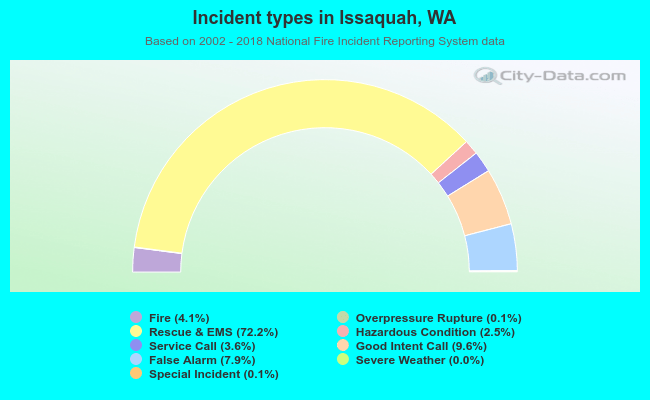 Out of all 26,461 cases reported during the years 2002 - 2018, the most belonged to the categories: Rescue & EMS (72.2%), Good Intent Call (9.6%), and False Alarm (7.9%).
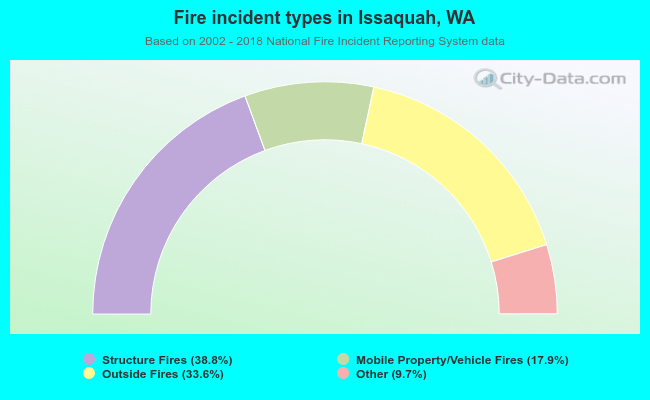 When looking into fire subcategories, the most incidents belonged to: Structure Fires (38.8%), and Outside Fires (33.6%).