Maple Valley: Fire Incidents, Washington (WA)
Where are fire incidents reported in Maple Valley, WA
Something went wrong! Please refresh the page.
| Fire incidents reported | |
|---|---|
| Sreet name | Count |
| MAPLE VALLEY HWY | 110 |
| MAPLE VALLEY HY | 76 |
| WAX RD | 56 |
| 248 ST | 52 |
| KENT KANGLEY RD | 52 |
| WITTE RD | 52 |
| 196 AVE | 36 |
| 240 ST | 36 |
| 216 ST | 32 |
| CEDAR GROVE RD | 30 |
| LAKE FRANCIS RD | 28 |
| 272 ST | 26 |
| 280 ST | 26 |
| 244 AVE | 24 |
| 204 AVE | 22 |
| MAXWELL RD | 22 |
| 192 ST | 20 |
| 223 PL | 20 |
| 224 ST | 18 |
| 235 AVE | 18 |
| 276 AVE | 18 |
| PETROVITSKY RD | 18 |
| 212 PL | 16 |
| 231 ST | 16 |
| 264 ST | 16 |
| 276 ST | 16 |
| 279 ST | 16 |
| 283 ST | 16 |
| JONES RD | 16 |
| LAKE WILDERNESS DR | 16 |
| Other | 372 |
2002 - 2018 National Fire Incident Reporting System (NFIRS) incidents
- Incident types reported to NFIRS in Maple Valley, WA
- 1,80032.0%Rescue & EMS
- 1,29223.0%Fire
- 76413.6%Good Intent Call
- 76013.5%Hazardous Condition
- 65911.7%Service Call
- 2734.9%False Alarm
- 520.9%Severe Weather
- 110.2%Special Incident
- 100.2%Overpressure Rupture
- Fire incident types reported to NFIRS in Maple Valley, WA
- 54342.0%Structure Fires
- 51539.9%Outside Fires
- 19415.0%Mobile Property/Vehicle Fires
- 403.1%Other
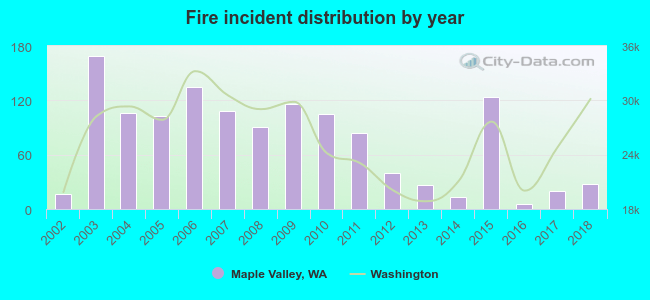 According to the data from the years 2002 - 2018 the average number of fires per year is 76. The highest number of reported fire incidents - 169 took place in 2003, and the least - 6 in 2016. The data has a growing trend.
The average number of yearly fire incidents per 10k residents in Maple Valley, WA compared to nearest cities:
(Note: Based on data for the last 3 years, including only cities with population 5,000 and above)
| Maple Valley: | 7.2 |
| Covington: | 17.4 |
| Kent: | 38.4 |
| Auburn: | 54.1 |
| Renton: | 52.4 |
| Lake Tapps: | 10.1 |
| Enumclaw: | 59.8 |
| Issaquah: | 26.1 |
| Pacific: | 31.1 |
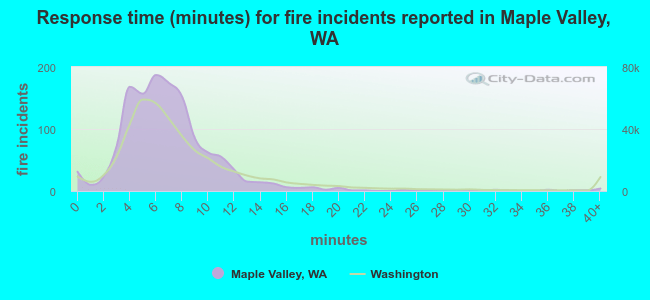 The median response time based on all reported fire incidents is 6 minutes. This is similar to the Washington median value.
The median response time in Maple Valley, WA compared to nearest cities:
(Note: Based on data for all years, including only cities with at least 500 fire incidents)
| Maple Valley: | 6 minutes |
| Covington: | 6 minutes |
| Kent: | 6 minutes |
| Auburn: | 6 minutes |
| Renton: | 6 minutes |
| Enumclaw: | 8 minutes |
| Issaquah: | 7 minutes |
| SeaTac: | 5 minutes |
| Des Moines: | 5 minutes |
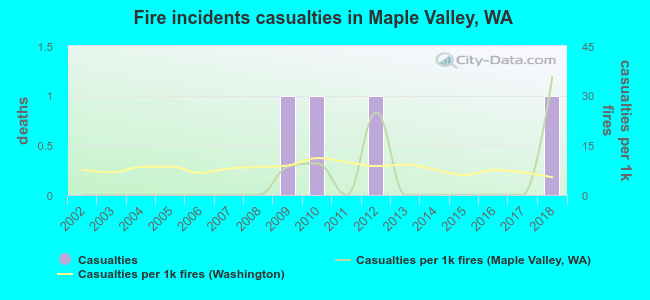 According to the data from the years 2002 - 2018 the average number of fire-related casualties per year is 0. The highest number of casualties - 1 took place in 2009, and the lowest - 0 in 2002. The data has a rising trend.
The average number of casualties per 1,000 fires is 5. This indicator was the highest - 36 in 2018, and the lowest 0 in 2002. The trend for casualties per 1,000 fires is rising. Compared to the state value the number of injuries per 1,000 fires is much lower.
According to the data from the years 2002 - 2018 the average number of fire-related casualties per year is 0. The highest number of casualties - 1 took place in 2009, and the lowest - 0 in 2002. The data has a rising trend.
The average number of casualties per 1,000 fires is 5. This indicator was the highest - 36 in 2018, and the lowest 0 in 2002. The trend for casualties per 1,000 fires is rising. Compared to the state value the number of injuries per 1,000 fires is much lower.
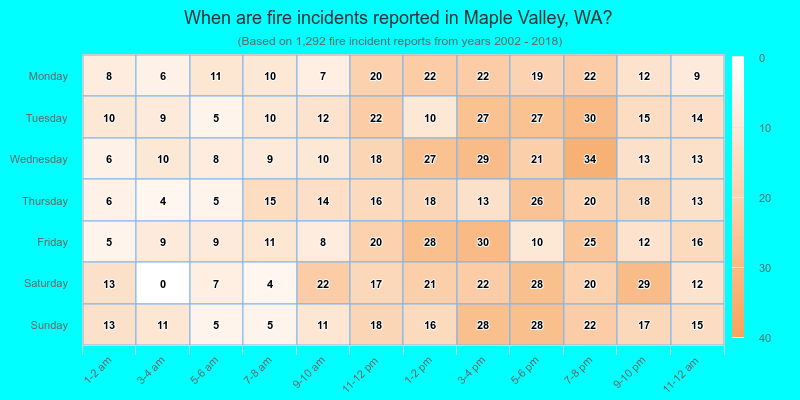
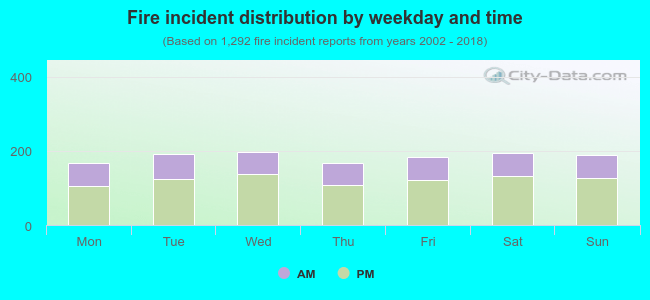 34.0% incidents where reported in the morning and 66.0% in the evening. The most fires (15.3%) took place on Wednesday, and the least (13.0%) on Monday.
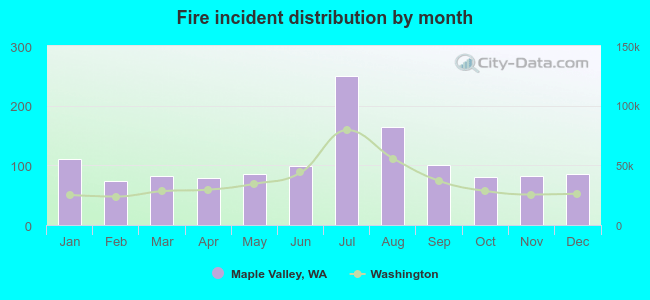 According to the 1,292 fire incident reports from years 2002 - 2018 most fires (19.3%) took place during July, and the least (5.7%) in February.
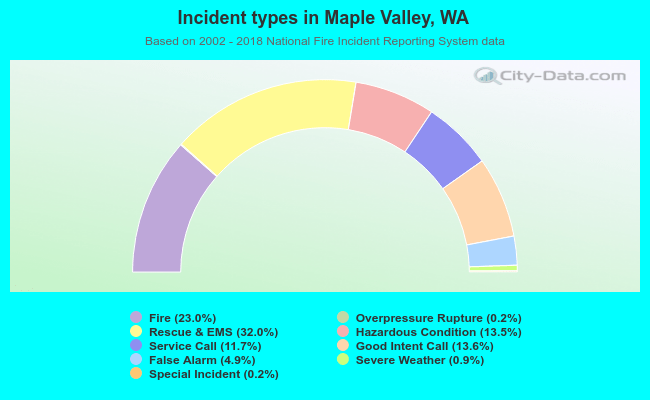 Out of all 5,621 cases reported during the years 2002 - 2018, the most belonged to the categories: Rescue & EMS (32.0%), Fire (23.0%), and Good Intent Call (13.6%).
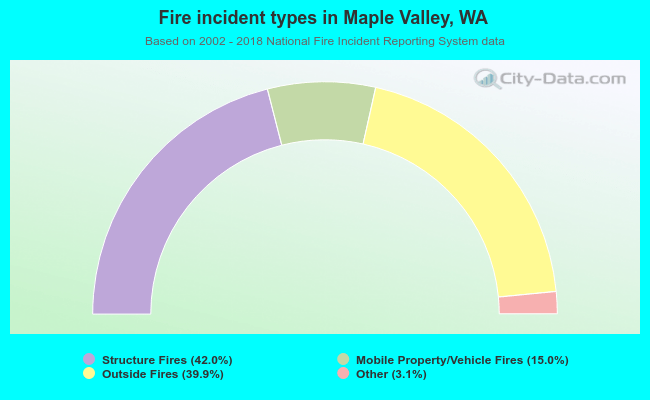 When looking into fire subcategories, the most incidents belonged to: Structure Fires (42.0%), and Outside Fires (39.9%).