Jamestown: Fire Incidents, North Dakota (ND)
Where are fire incidents reported in Jamestown, ND
Something went wrong! Please refresh the page.
| Fire incidents reported | |
|---|---|
| Sreet name | Count |
| 2ND AVE | 70 |
| 1ST AVE | 68 |
| 4TH AVE | 68 |
| 3RD AVE | 62 |
| 2ND ST | 56 |
| 5TH AVE | 50 |
| 3RD ST | 48 |
| 11TH AVE | 46 |
| 8TH AVE | 46 |
| 10TH ST | 44 |
| 6TH AVE | 40 |
| 11TH ST | 34 |
| 7TH AVE | 34 |
| 17TH ST | 26 |
| 4TH ST | 26 |
| 12TH AVE | 24 |
| 1ST ST | 24 |
| 281 HWY | 22 |
| I94 | 22 |
| 13TH ST | 20 |
| 25TH ST | 18 |
| 5TH ST | 18 |
| 9TH AVE | 18 |
| BUSINESS LOOP | 18 |
| I94 HWY | 18 |
| 10TH AVE | 16 |
| GARDENETTE DR | 16 |
| 16TH ST | 14 |
| 18TH ST | 14 |
| 37TH ST | 14 |
| Other | 203 |
2002 - 2018 National Fire Incident Reporting System (NFIRS) incidents
- Incident types reported to NFIRS in Jamestown, ND
- 1,19744.2%Fire
- 80829.8%False Alarm
- 38414.2%Hazardous Condition
- 1736.4%Good Intent Call
- 843.1%Service Call
- 361.3%Special Incident
- 271.0%Rescue & EMS
- Fire incident types reported to NFIRS in Jamestown, ND
- 51242.8%Outside Fires
- 44136.8%Structure Fires
- 23019.2%Mobile Property/Vehicle Fires
- 141.2%Other
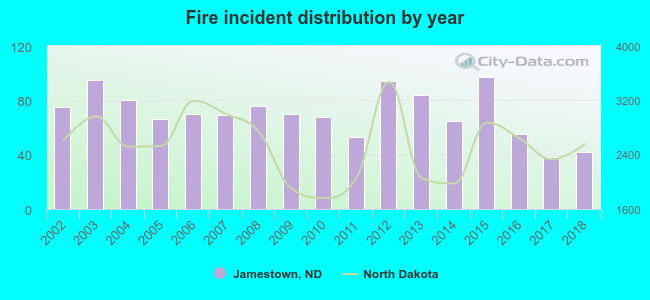 Based on the data from the years 2002 - 2018 the average number of fire incidents per year is 70. The highest number of reported fire incidents - 97 took place in 2015, and the least - 38 in 2017. The data has a dropping trend.
The average number of yearly fire incidents per 10k residents in Jamestown, ND compared to nearest cities:
(Note: Based on data for the last 3 years, including only cities with population 5,000 and above)
| Jamestown: | 29.1 |
| Valley City: | 42.9 |
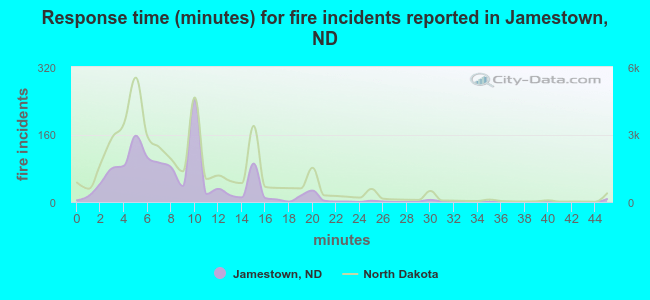 The median response time based on all reported fire incidents is 8 minutes. This is similar to the state median value.
The median response time in Jamestown, ND compared to nearest cities:
(Note: Based on data for all years, including only cities with at least 500 fire incidents)
| Jamestown: | 8 minutes |
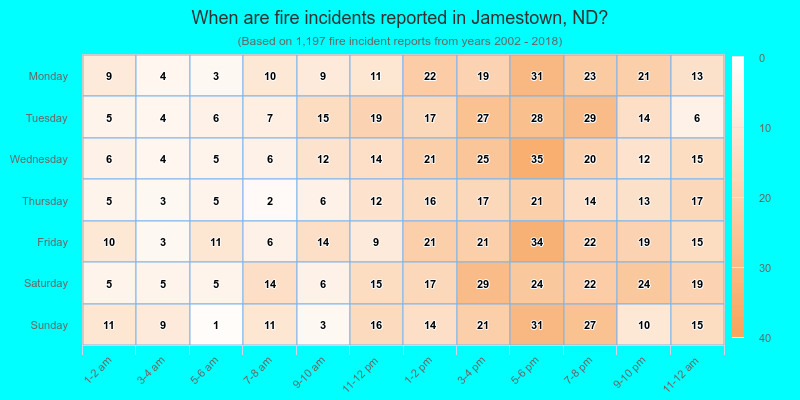
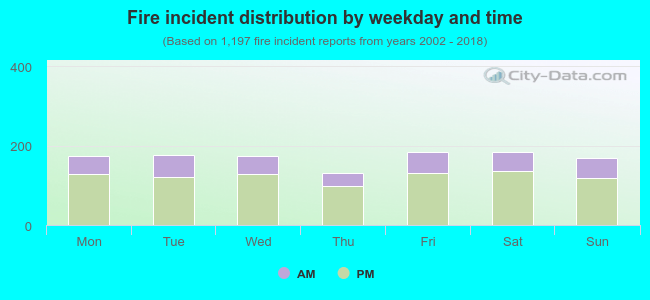 28.1% incidents where reported in the morning and 71.9% in the evening. The most fires (15.5%) took place on Friday, and the least (10.9%) on Thursday.
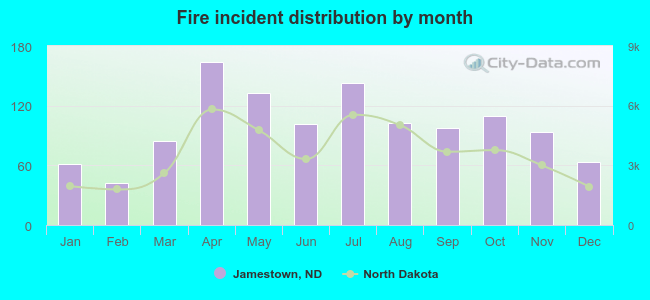 Based on the 1,197 reports from years 2002 - 2018 most fires (13.7%) took place during April, and the least (3.5%) in February.
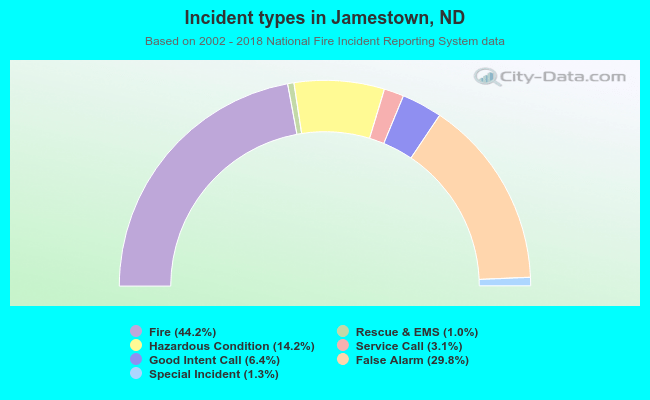 Out of all 2,709 cases reported during the years 2002 - 2018, the most belonged to the categories: Fire (44.2%), Good Intent Call (29.8%), and Rescue & EMS (14.2%).
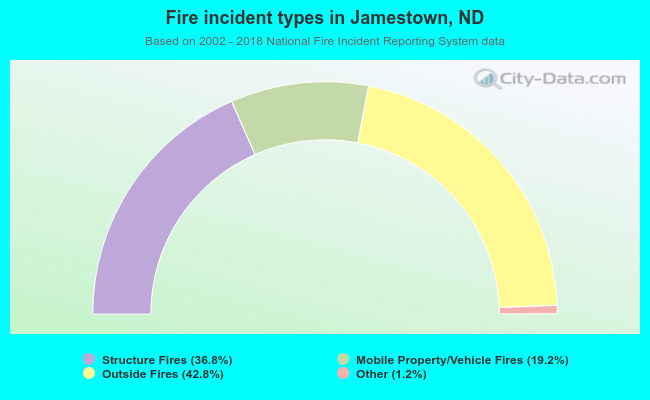 When looking into fire subcategories, the most reports belonged to: Outside Fires (42.8%), and Structure Fires (36.8%).