Valley City: Fire Incidents, North Dakota (ND)
Where are fire incidents reported in Valley City, ND
Something went wrong! Please refresh the page.
|
| |||||||||||||||||||||||||||||||||||||||||||||||||||||||||||||||||||||||||||||||||||||||||||||||||||||||||||||
| Other | 7 | |||||||||||||||||||||||||||||||||||||||||||||||||||||||||||||||||||||||||||||||||||||||||||||||||||||||||||||
2002 - 2018 National Fire Incident Reporting System (NFIRS) incidents
- Incident types reported to NFIRS in Valley City, ND
- 45549.2%Fire
- 25427.5%Hazardous Condition
- 10511.4%False Alarm
- 424.5%Service Call
- 343.7%Rescue & EMS
- 262.8%Good Intent Call
- 60.6%Overpressure Rupture
- 30.3%Special Incident
- Fire incident types reported to NFIRS in Valley City, ND
- 21346.8%Structure Fires
- 14131.0%Outside Fires
- 10022.0%Mobile Property/Vehicle Fires
- 10.2%Other
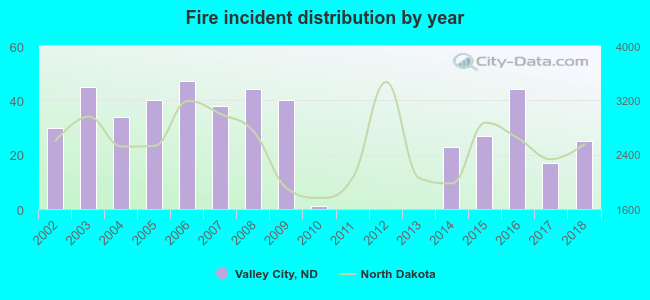 Based on the data from the years 2002 - 2018 the average number of fires per year is 27. The highest number of reported fires - 47 took place in 2006, and the least - 0 in 2011. The data has a dropping trend.
The average number of yearly fire incidents per 10k residents in Valley City, ND compared to nearest cities:
(Note: Based on data for the last 3 years, including only cities with population 5,000 and above)
| Valley City: | 42.9 |
| Jamestown: | 29.1 |
| West Fargo: | 15.5 |
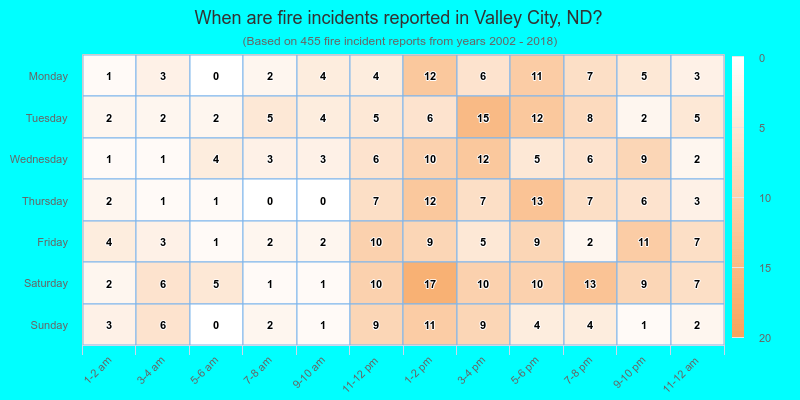
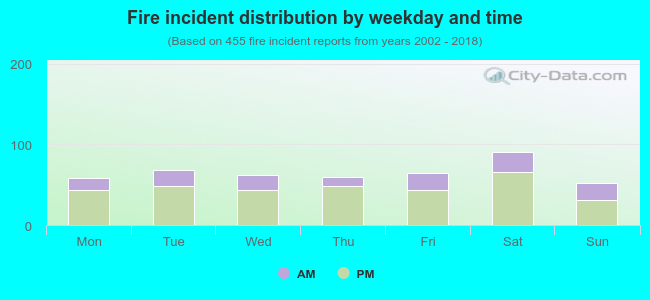 28.8% incidents where reported in the morning and 71.2% in the evening. The most fires (20.0%) took place on Saturday, and the least (11.4%) on Sunday.
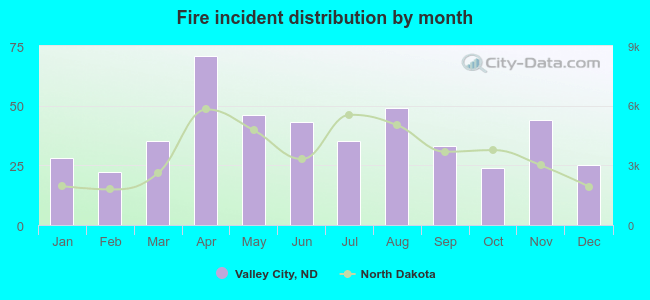 Based on the 455 reports from years 2002 - 2018 most fires (15.6%) took place during April, and the least (4.8%) in February.
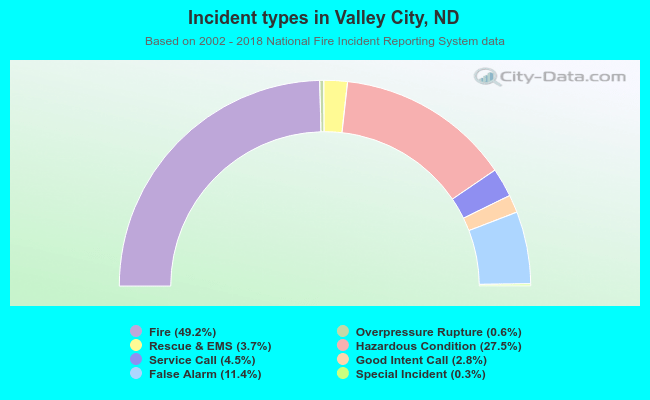 Out of all 925 cases reported during the years 2002 - 2018, the most belonged to the categories: Fire (49.2%), Hazardous Condition (27.5%), and False Alarm (11.4%).
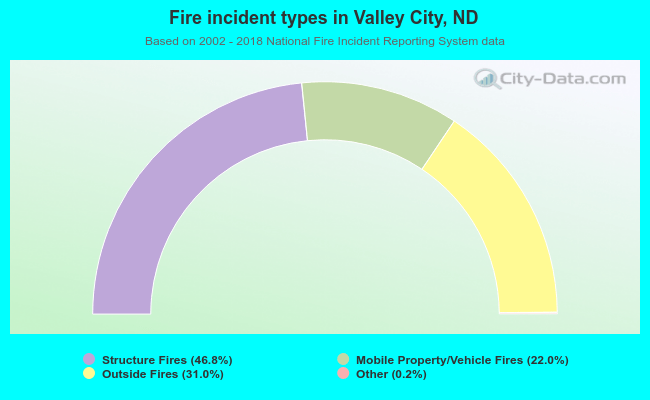 When looking into fire subcategories, the most incidents belonged to: Structure Fires (46.8%), and Outside Fires (31.0%).