Johnstown: Fire Incidents, Pennsylvania (PA)
Where are fire incidents reported in Johnstown, PA
Something went wrong! Please refresh the page.
| Fire incidents reported | |
|---|---|
| Sreet name | Count |
| SOLOMON ST | 154 |
| COOPER AVE | 138 |
| FRANKLIN ST | 66 |
| GOUCHER ST | 64 |
| VINE ST | 56 |
| MAIN ST | 54 |
| BEDFORD ST | 50 |
| MENOHER BLVD | 48 |
| OAK ST | 48 |
| WILLIAM PENN | 48 |
| FAIRFIELD AVE | 42 |
| BEDFORD | 38 |
| ST CLAIR RD | 38 |
| D ST | 36 |
| MAIN | 34 |
| ADMIRAL PEARY | 32 |
| GOUCHER | 32 |
| SCALP | 32 |
| COOPER | 30 |
| DECKER AVE | 30 |
| GROVE AVE | 28 |
| MOUNTAIN RD | 28 |
| CENTRAL AVE | 26 |
| GALLERIA | 26 |
| HIGHLAND AVE | 26 |
| HORNER ST | 26 |
| COLEMAN AVE | 24 |
| FRANKLIN | 24 |
| FRANKSTOWN | 24 |
| MINNO DR | 24 |
| Other | 1,340 |
2003 - 2018 National Fire Incident Reporting System (NFIRS) incidents
- Incident types reported to NFIRS in Johnstown, PA
- 5,38427.5%Hazardous Condition
- 3,99420.4%Rescue & EMS
- 3,02815.5%False Alarm
- 2,81514.4%Service Call
- 2,66613.6%Fire
- 1,1145.7%Good Intent Call
- 3651.9%Severe Weather
- 1590.8%Special Incident
- 330.2%Overpressure Rupture
- Fire incident types reported to NFIRS in Johnstown, PA
- 1,59759.9%Structure Fires
- 53320.0%Outside Fires
- 32412.2%Mobile Property/Vehicle Fires
- 2128.0%Other
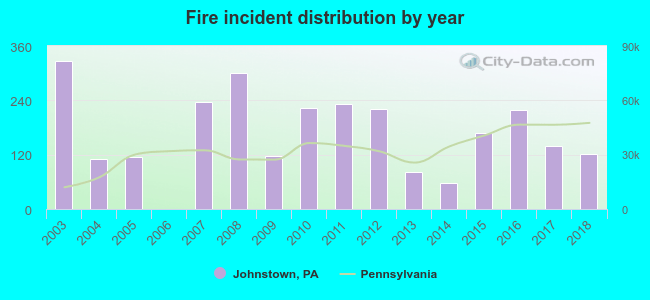 According to the data from the years 2003 - 2018 the average number of fire incidents per year is 167. The highest number of fire incidents - 326 took place in 2003, and the least - 0 in 2006. The data has a decreasing trend.
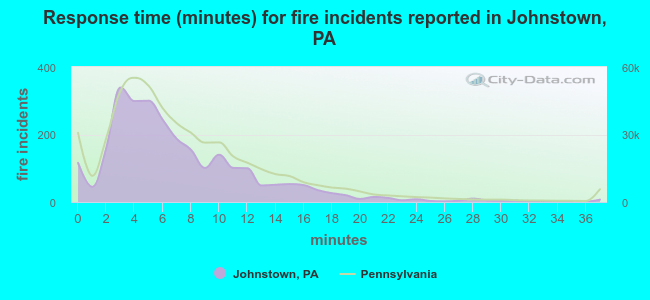 The median response time based on all reported fire incidents is 6 minutes. This is comparable to the state median value.
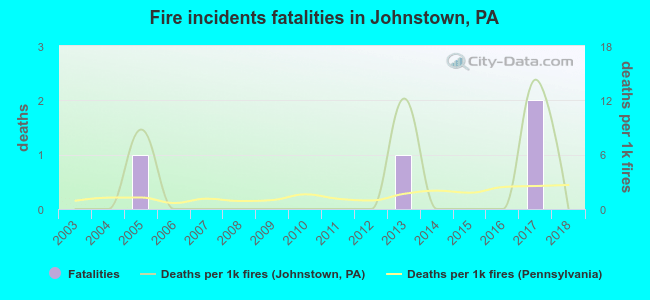 According to the reports from the years 2003 - 2018 the average number of fire-related fatalities per year is 0. The highest number of deaths - 2 took place in 2017, and the lowest - 0 in 2003. The data has a constant trend.
The average number of fatalities per 1,000 fire incidents is 2. This indicator was the highest - 14 in 2017, and the lowest 0 in 2003. The trend for deaths per 1,000 fires is constant. Compared to the Pennsylvania value the number of fatalities per 1,000 fires is about the same.
According to the reports from the years 2003 - 2018 the average number of fire-related fatalities per year is 0. The highest number of deaths - 2 took place in 2017, and the lowest - 0 in 2003. The data has a constant trend.
The average number of fatalities per 1,000 fire incidents is 2. This indicator was the highest - 14 in 2017, and the lowest 0 in 2003. The trend for deaths per 1,000 fires is constant. Compared to the Pennsylvania value the number of fatalities per 1,000 fires is about the same.Deaths per 1,000 incidents in Johnstown, PA compared to nearest cities:
(Note: Based on data for all years, including only cities with at least 2,500 fire incidents)
| Johnstown: | 1.5 |
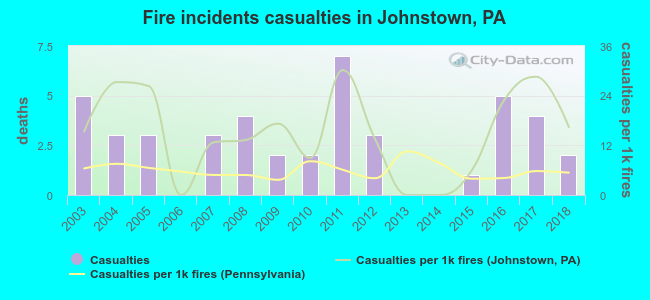 According to the reports from the years 2003 - 2018 the average number of fire-related casualties per year is 3. The highest number of casualties - 7 took place in 2011, and the lowest - 0 in 2006. The data has a dropping trend.
The average number of casualties per 1,000 fire incidents is 15. This indicator was the highest - 30 in 2011, and the lowest 0 in 2006. The trend for casualties per 1,000 incidents is rising. Compared to the Pennsylvania value the number of casualties per 1,000 fires is much higher.
According to the reports from the years 2003 - 2018 the average number of fire-related casualties per year is 3. The highest number of casualties - 7 took place in 2011, and the lowest - 0 in 2006. The data has a dropping trend.
The average number of casualties per 1,000 fire incidents is 15. This indicator was the highest - 30 in 2011, and the lowest 0 in 2006. The trend for casualties per 1,000 incidents is rising. Compared to the Pennsylvania value the number of casualties per 1,000 fires is much higher.
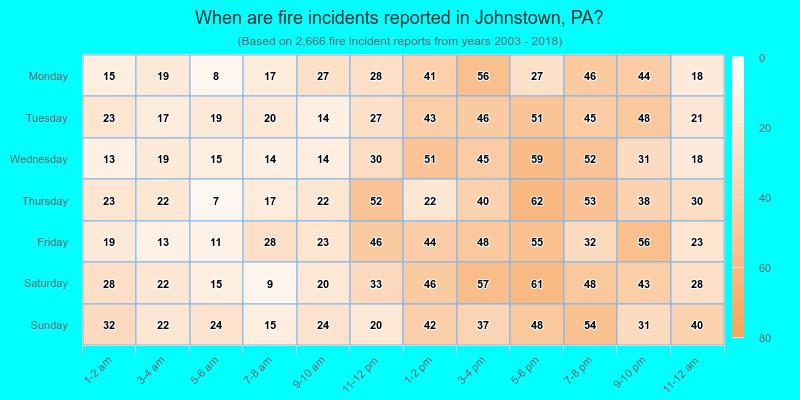
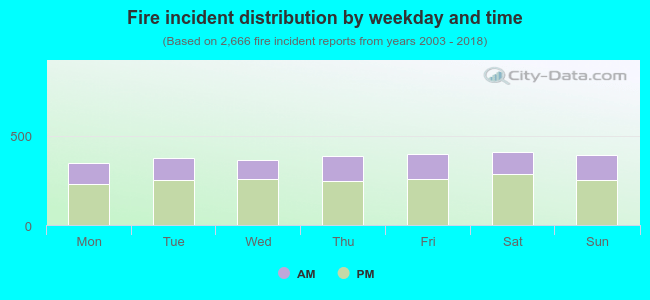 33.2% incidents where reported in the morning and 66.8% in the evening. The most fires (15.4%) took place on Saturday, and the least (13.0%) on Monday.
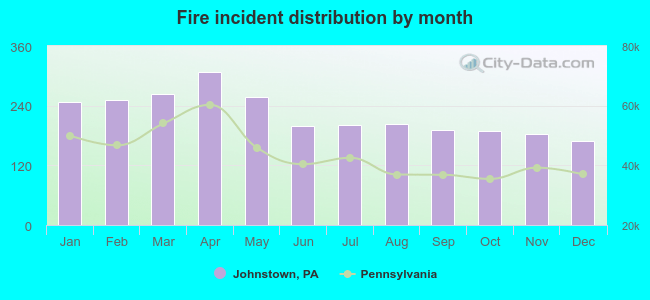 According to the 2,666 fires from years 2003 - 2018 most fires (11.6%) took place during April, and the least (6.3%) in December.
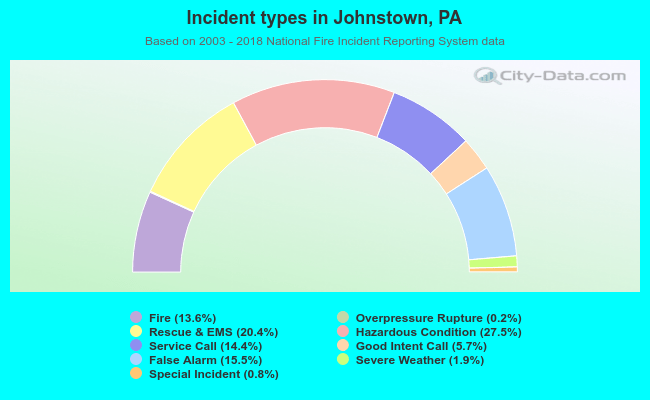 Out of all 19,558 cases reported during the years 2003 - 2018, the most belonged to the categories: Hazardous Condition (27.5%), Rescue & EMS (20.4%), and False Alarm (15.5%).
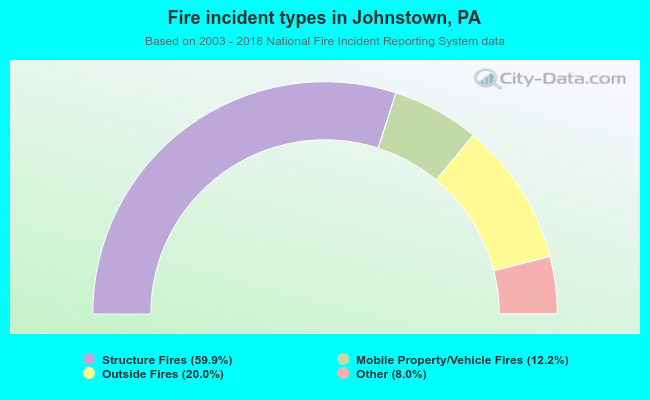 When looking into fire subcategories, the most incidents belonged to: Structure Fires (59.9%), and Outside Fires (20.0%).