Somerset: Fire Incidents, Pennsylvania (PA)
Where are fire incidents reported in Somerset, PA
Something went wrong! Please refresh the page.
| Fire incidents reported | |
|---|---|
| Sreet name | Count |
| PENNSYLVANIA TURNPIKE TPKE | 102 |
| CENTER AVE | 76 |
| GLADES PIKE HWY | 46 |
| MAIN ST | 42 |
| EDGEWOOD AVE | 32 |
| GLADES PIKE | 26 |
| NEW CENTERVILLE RD | 22 |
| PATRIOT ST | 20 |
| BERLIN PLANK RD | 18 |
| E MAIN ST | 18 |
| GARY LN | 18 |
| N CENTER AV | 18 |
| UNKNOWN | 18 |
| S EDGEWOOD AV | 16 |
| BURGESS ST | 14 |
| CHERRY | 14 |
| CHERRY LN | 14 |
| LAVANSVILLE RD | 14 |
| STOYSTOWN RD | 14 |
| WATER LEVEL RD | 14 |
| CENTER | 12 |
| SOMERSET PIKE | 12 |
| WAYNE LN | 12 |
| CHERRY LA | 10 |
| COXES CREEK RD | 10 |
| DONALD LN | 10 |
| GARDNER RD | 10 |
| GARDNER RD | 10 |
| LAKE RD | 10 |
| NEW CENTERVILLE RD | 10 |
| Other | 516 |
2003 - 2018 National Fire Incident Reporting System (NFIRS) incidents
- Incident types reported to NFIRS in Somerset, PA
- 1,17836.2%Fire
- 57817.8%Hazardous Condition
- 54716.8%Rescue & EMS
- 41012.6%Good Intent Call
- 2868.8%False Alarm
- 1745.3%Service Call
- 652.0%Severe Weather
- 160.5%Special Incident
- Fire incident types reported to NFIRS in Somerset, PA
- 64154.4%Structure Fires
- 22719.3%Outside Fires
- 15913.5%Other
- 15112.8%Mobile Property/Vehicle Fires
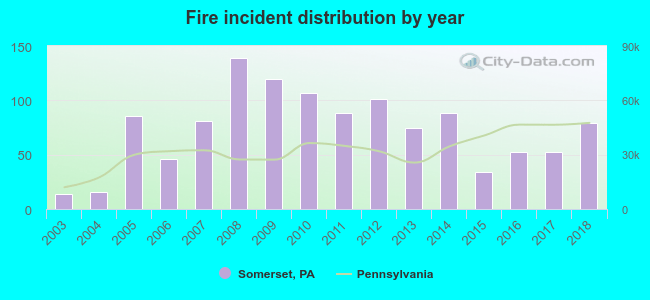 According to the data from the years 2003 - 2018 the average number of fires per year is 74. The highest number of fire incidents - 139 took place in 2008, and the least - 14 in 2003. The data has a rising trend.
The average number of yearly fire incidents per 10k residents in Somerset, PA compared to nearest cities:
(Note: Based on data for the last 3 years, including only cities with population 5,000 and above)
| Somerset: | 100.1 |
| Johnstown: | 79.3 |
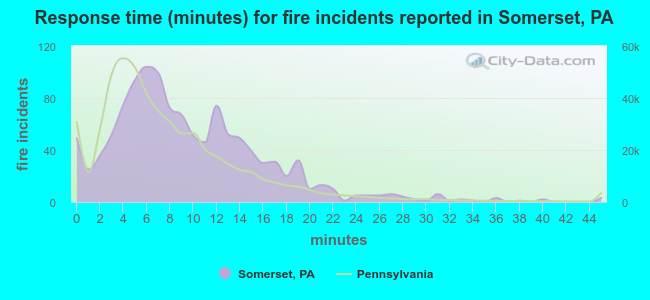 The median response time based on all reported fire incidents is 8 minutes. This is higher than the Pennsylvania median value.
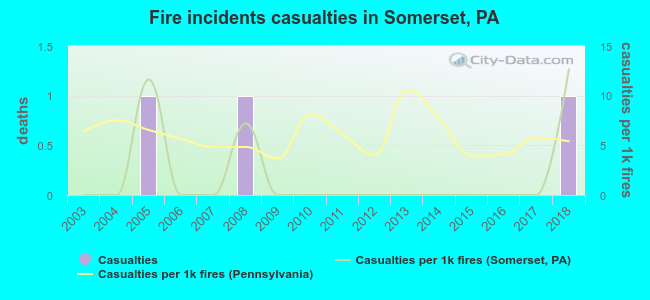 Based on the reports from the years 2003 - 2018 the average number of fire-related casualties per year is 0. The highest number of reported injuries - 1 took place in 2005, and the lowest - 0 in 2003. The data has a growing trend.
The average number of casualties per 1,000 fire incidents is 2. This indicator was the highest - 13 in 2018, and the lowest 0 in 2003. The trend for casualties per 1,000 fire incidents is rising. Compared to the state value the number of casualties per 1,000 incidents is much lower.
Based on the reports from the years 2003 - 2018 the average number of fire-related casualties per year is 0. The highest number of reported injuries - 1 took place in 2005, and the lowest - 0 in 2003. The data has a growing trend.
The average number of casualties per 1,000 fire incidents is 2. This indicator was the highest - 13 in 2018, and the lowest 0 in 2003. The trend for casualties per 1,000 fire incidents is rising. Compared to the state value the number of casualties per 1,000 incidents is much lower.
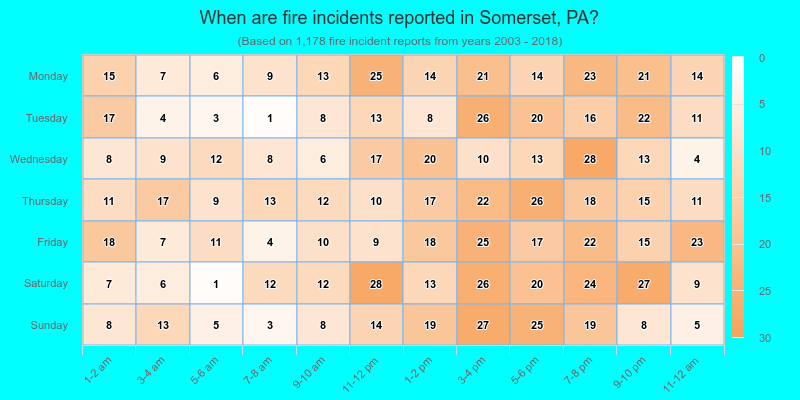
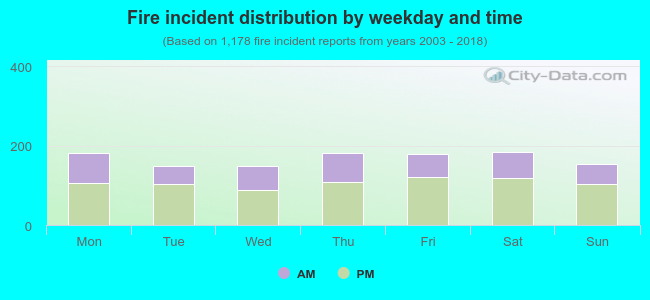 36.4% incidents where reported in the morning and 63.6% in the evening. The most fires (15.7%) took place on Saturday, and the least (12.6%) on Wednesday.
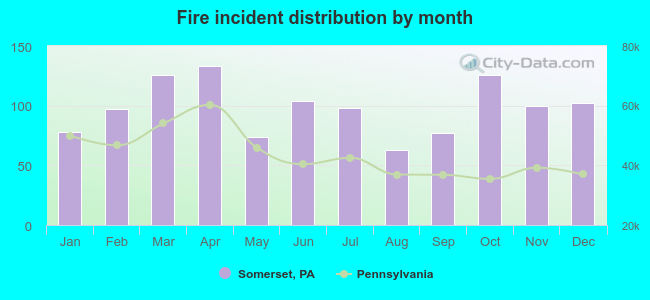 According to the 1,178 fire incident reports from years 2003 - 2018 most fires (11.3%) took place during April, and the least (5.3%) in August.
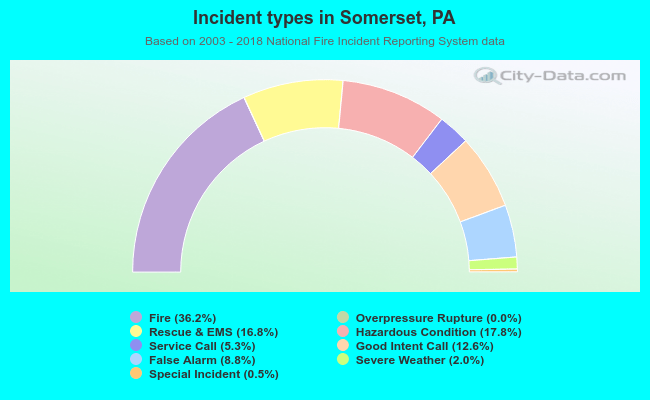 Out of all 3,255 cases reported during the years 2003 - 2018, the most belonged to the categories: Fire (36.2%), Hazardous Condition (17.8%), and Rescue & EMS (16.8%).
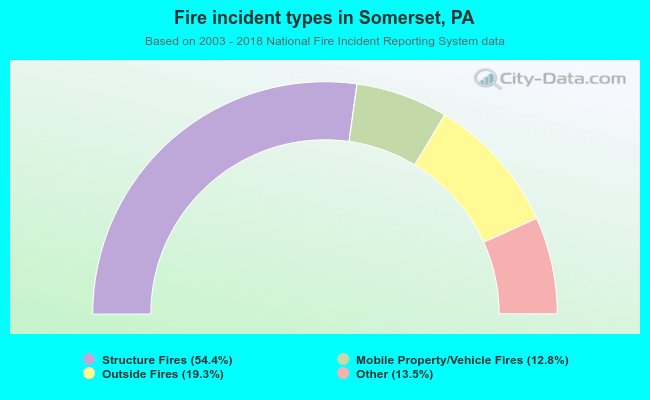 When looking into fire subcategories, the most incidents belonged to: Structure Fires (54.4%), and Outside Fires (19.3%).