Keansburg: Fire Incidents, New Jersey (NJ)
Where are fire incidents reported in Keansburg, NJ
Something went wrong! Please refresh the page.
|
| |||||||||||||||||||||||||||||||||||||||||||||||||||||||||||||||||||||||||||||||||||||||||||||||||||||||||||||
2005 - 2018 National Fire Incident Reporting System (NFIRS) incidents
- Incident types reported to NFIRS in Keansburg, NJ
- 49033.4%Hazardous Condition
- 48232.9%Fire
- 28319.3%False Alarm
- 1298.8%Service Call
- 624.2%Rescue & EMS
- 141.0%Good Intent Call
- 30.2%Severe Weather
- 20.1%Overpressure Rupture
- Fire incident types reported to NFIRS in Keansburg, NJ
- 27657.3%Structure Fires
- 16534.2%Outside Fires
- 347.1%Mobile Property/Vehicle Fires
- 71.5%Other
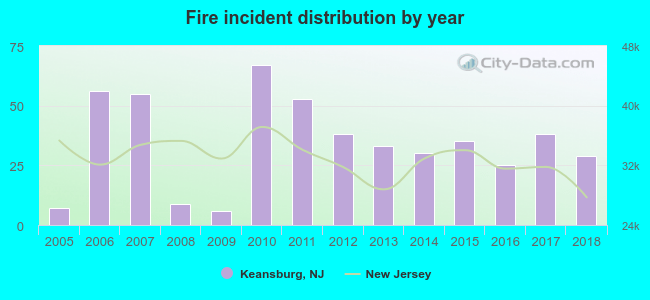 Based on the data from the years 2005 - 2018 the average number of fires per year is 34. The highest number of reported fire incidents - 67 took place in 2010, and the least - 6 in 2009. The data has an increasing trend.
The average number of yearly fire incidents per 10k residents in Keansburg, NJ compared to nearest cities:
(Note: Based on data for the last 3 years, including only cities with population 5,000 and above)
| Keansburg: | 31.1 |
| Union Beach: | 53.2 |
| Keyport: | 58.2 |
| Matawan: | 41.3 |
| Laurence Harbor: | 5.4 |
| Lincroft: | 19.6 |
| Red Bank: | 28.4 |
| Fair Haven: | 13.2 |
| South Amboy: | 51.2 |

 31.7% incidents where reported in the morning and 68.3% in the evening. The most fires (17.6%) took place on Saturday, and the least (11.6%) on Tuesday.
 According to the 482 incident reports from years 2005 - 2018 most fires (14.3%) took place during April, and the least (4.8%) in December.
 Out of all 1,466 cases reported during the years 2005 - 2018, the most belonged to the categories: Hazardous Condition (33.4%), Fire (32.9%), and False Alarm (19.3%).
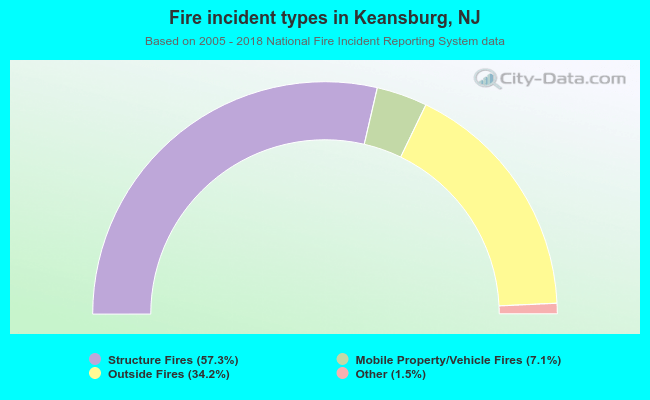 When looking into fire subcategories, the most reports belonged to: Structure Fires (57.3%), and Outside Fires (34.2%).