Keyport: Fire Incidents, New Jersey (NJ)
Where are fire incidents reported in Keyport, NJ
Something went wrong! Please refresh the page.
| Fire incidents reported | |
|---|---|
| Sreet name | Count |
| BROAD ST | 280 |
| FRONT ST | 198 |
| BEERS ST | 92 |
| MAIN ST | 56 |
| BROADWAY | 54 |
| GREEN GROVE AVE | 50 |
| SECOND ST | 48 |
| MAPLE PL | 38 |
| ATLANTIC ST | 34 |
| FIRST ST | 34 |
| STATE 36 HWY | 30 |
| FULTON ST | 26 |
| CHURCH ST | 22 |
| HIGHWAY 35 | 22 |
| OSBORN ST | 22 |
| DIVISION ST | 20 |
| LOCUST ST | 20 |
| CLARK ST | 16 |
| THIRD ST | 16 |
| HIGHWAY 36 | 14 |
| WASHINGTON ST | 14 |
| CHINGARORA AVE | 12 |
| KEARNEY ST | 12 |
| WEST FRONT ST | 12 |
| CENTER ST | 10 |
| HURLEY ST | 10 |
| STATE 35 HWY | 10 |
| HWY 35 | 8 |
| JACKSON ST | 8 |
| LUPPATATONG AVE | 8 |
2002 - 2018 National Fire Incident Reporting System (NFIRS) incidents
- Incident types reported to NFIRS in Keyport, NJ
- 77626.4%Fire
- 72424.7%Hazardous Condition
- 67122.9%Rescue & EMS
- 38913.2%False Alarm
- 1525.2%Special Incident
- 1434.9%Service Call
- 682.3%Good Intent Call
- 90.3%Severe Weather
- 40.1%Overpressure Rupture
- Fire incident types reported to NFIRS in Keyport, NJ
- 46559.9%Structure Fires
- 19525.1%Outside Fires
- 7810.1%Mobile Property/Vehicle Fires
- 384.9%Other
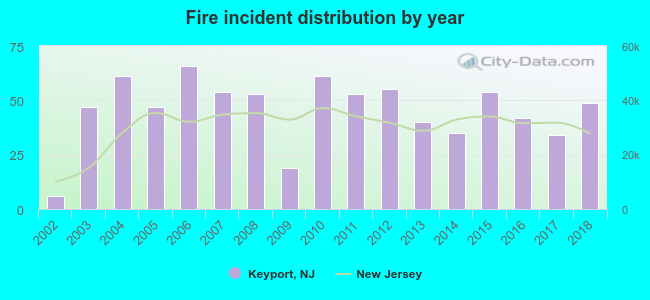 Based on the data from the years 2002 - 2018 the average number of fire incidents per year is 46. The highest number of fires - 66 took place in 2006, and the least - 6 in 2002. The data has a growing trend.
The average number of yearly fire incidents per 10k residents in Keyport, NJ compared to nearest cities:
(Note: Based on data for the last 3 years, including only cities with population 5,000 and above)
| Keyport: | 58.2 |
| Union Beach: | 53.2 |
| Matawan: | 41.3 |
| Laurence Harbor: | 5.4 |
| Keansburg: | 31.1 |
| South Amboy: | 51.2 |
| Sayreville: | 11.2 |
| Perth Amboy: | 32.8 |
| Old Bridge: | 38.9 |
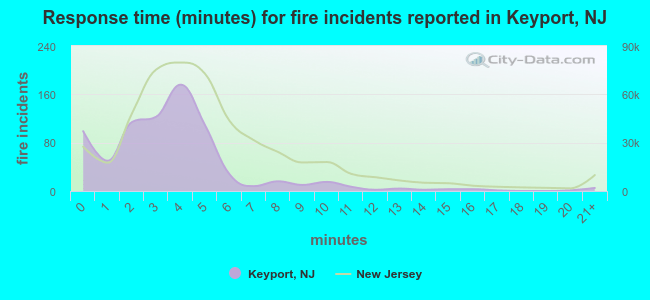 The median response time based on all reported fire incidents is 4 minutes. This is lower compared to the state median value.
The median response time in Keyport, NJ compared to nearest cities:
(Note: Based on data for all years, including only cities with at least 500 fire incidents)
| Keyport: | 4 minutes |
| Matawan: | 4 minutes |
| South Amboy: | 3 minutes |
| Sayreville: | 5 minutes |
| Perth Amboy: | 4 minutes |
| Old Bridge: | 4 minutes |
| Morganville: | 4 minutes |
| Woodbridge: | 5 minutes |
| Carteret: | 3 minutes |
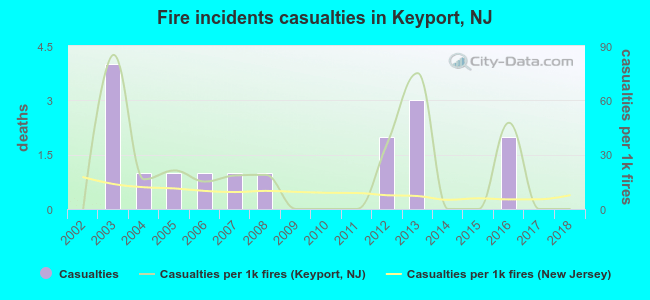 According to the data from the years 2002 - 2018 the average number of fire-related casualties per year is 1. The highest number of casualties - 4 took place in 2003, and the lowest - 0 in 2002. The data has a constant trend.
The average number of injuries per 1,000 fires is 20. This indicator was the highest - 85 in 2003, and the lowest 0 in 2002. The trend for injuries per 1,000 fire incidents is constant. Compared to the state value the number of casualties per 1,000 incidents is much higher.
According to the data from the years 2002 - 2018 the average number of fire-related casualties per year is 1. The highest number of casualties - 4 took place in 2003, and the lowest - 0 in 2002. The data has a constant trend.
The average number of injuries per 1,000 fires is 20. This indicator was the highest - 85 in 2003, and the lowest 0 in 2002. The trend for injuries per 1,000 fire incidents is constant. Compared to the state value the number of casualties per 1,000 incidents is much higher.Casualties per 1,000 incidents in Keyport, NJ compared to nearest cities:
(Note: Based on data for all years, including only cities with at least 500 fire incidents)
| Keyport: | 20.6 |
| Matawan: | 8.2 |
| South Amboy: | 13.2 |
| Sayreville: | 17.3 |
| Perth Amboy: | 45.4 |
| Old Bridge: | 9.9 |
| Morganville: | 1.7 |
| Woodbridge: | 15.2 |
| Carteret: | 6.0 |
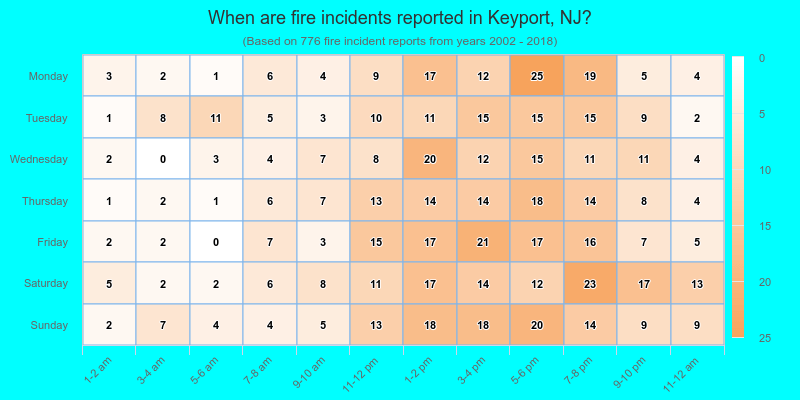
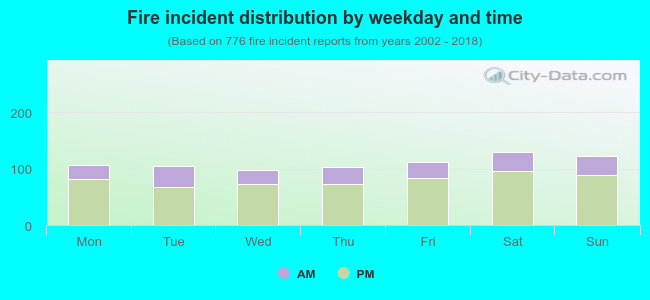 27.7% incidents where reported in the morning and 72.3% in the evening. The most fires (16.8%) took place on Saturday, and the least (12.5%) on Wednesday.
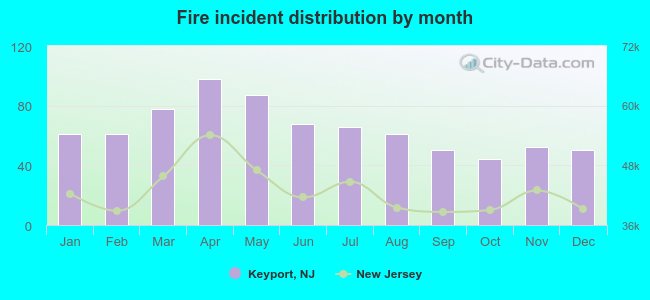 Based on the 776 fires from years 2002 - 2018 most fires (12.6%) took place during April, and the least (5.7%) in October.
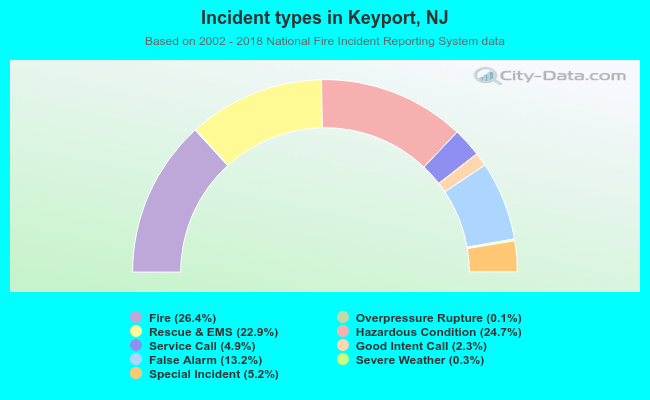 Out of all 2,936 cases reported during the years 2002 - 2018, the most belonged to the categories: Fire (26.4%), Hazardous Condition (24.7%), and Rescue & EMS (22.9%).
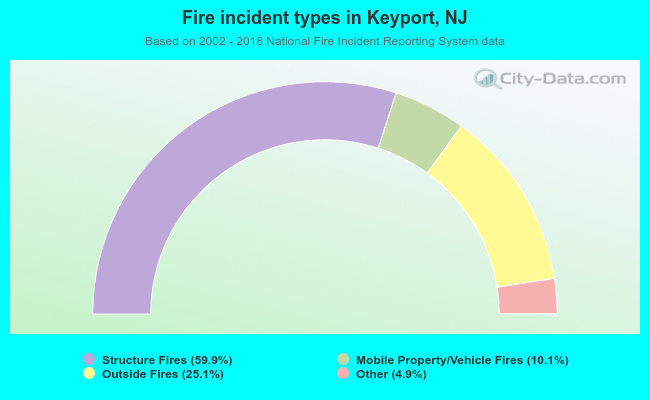 When looking into fire subcategories, the most incidents belonged to: Structure Fires (59.9%), and Outside Fires (25.1%).