Keene: Fire Incidents, Texas (TX)
Where are fire incidents reported in Keene, TX
Something went wrong! Please refresh the page.
|
| |||||||||||||||||||||||||||||||||||||||||||||||||||||||||||||||||||||||||||||||||||||||||||||||||||||||||||||
| Other | 54 | |||||||||||||||||||||||||||||||||||||||||||||||||||||||||||||||||||||||||||||||||||||||||||||||||||||||||||||
2002 - 2018 National Fire Incident Reporting System (NFIRS) incidents
- Incident types reported to NFIRS in Keene, TX
- 3,96059.5%Rescue & EMS
- 1,06616.0%Fire
- 5708.6%Service Call
- 5197.8%Good Intent Call
- 3825.7%Hazardous Condition
- 1452.2%False Alarm
- 90.1%Special Incident
- Fire incident types reported to NFIRS in Keene, TX
- 47144.2%Outside Fires
- 45242.4%Structure Fires
- 1039.7%Mobile Property/Vehicle Fires
- 403.8%Other
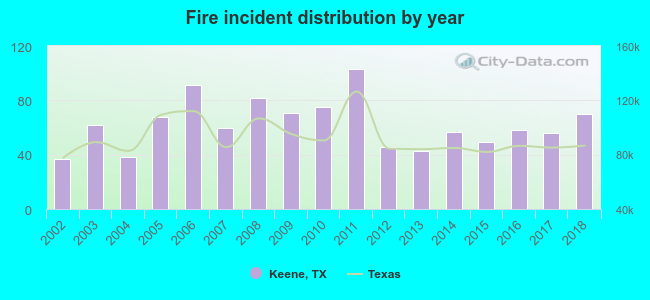 According to the data from the years 2002 - 2018 the average number of fire incidents per year is 63. The highest number of reported fire incidents - 103 took place in 2011, and the least - 37 in 2002. The data has a growing trend.
The average number of yearly fire incidents per 10k residents in Keene, TX compared to nearest cities:
(Note: Based on data for the last 3 years, including only cities with population 5,000 and above)
| Keene: | 99.7 |
| Cleburne: | 78.2 |
| Joshua: | 141.1 |
| Burleson: | 41.9 |
| Crowley: | 48.7 |
| Rendon: | 22.8 |
| Everman: | 45.4 |
| Mansfield: | 22.7 |
| Kennedale: | 64.9 |
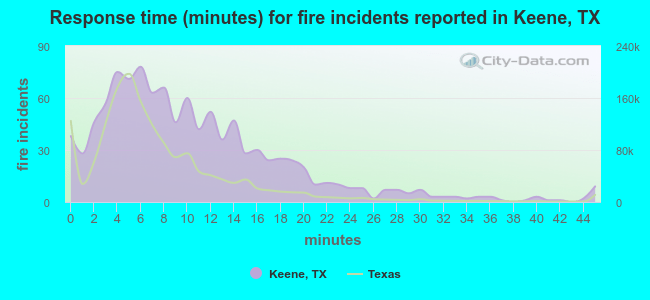 The median response time based on all reported fire incidents is 9 minutes. This is higher than the Texas median value.
The median response time in Keene, TX compared to nearest cities:
(Note: Based on data for all years, including only cities with at least 500 fire incidents)
| Keene: | 9 minutes |
| Cleburne: | 7 minutes |
| Joshua: | 11 minutes |
| Alvarado: | 10 minutes |
| Burleson: | 8 minutes |
| Rio Vista: | 15 minutes |
| Godley: | 13 minutes |
| Grandview: | 10 minutes |
| Crowley: | 6 minutes |
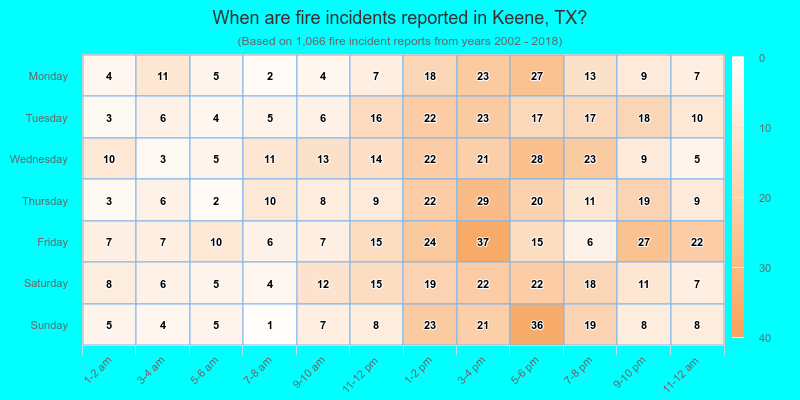
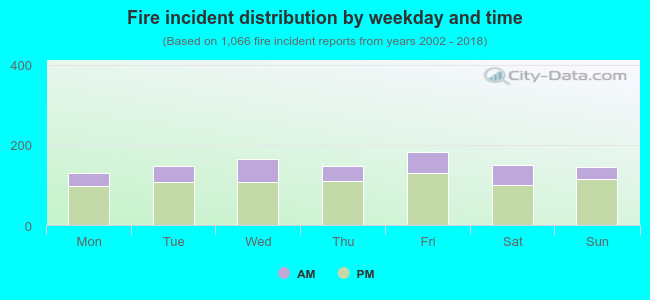 28.0% incidents where reported in the morning and 72.0% in the evening. The most fires (17.2%) took place on Friday, and the least (12.2%) on Monday.
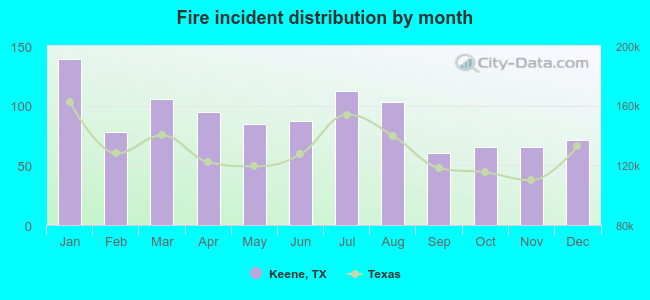 Based on the 1,066 fire incidents from years 2002 - 2018 most fires (13.0%) took place during January, and the least (5.6%) in September.
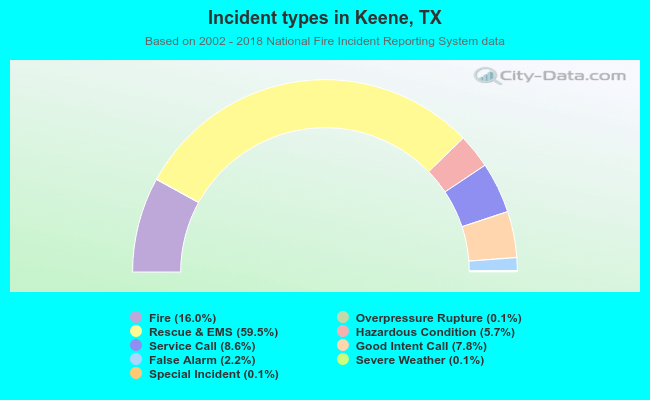 Out of all 6,659 cases reported during the years 2002 - 2018, the most belonged to the categories: Rescue & EMS (59.5%), Fire (16.0%), and Service Call (8.6%).
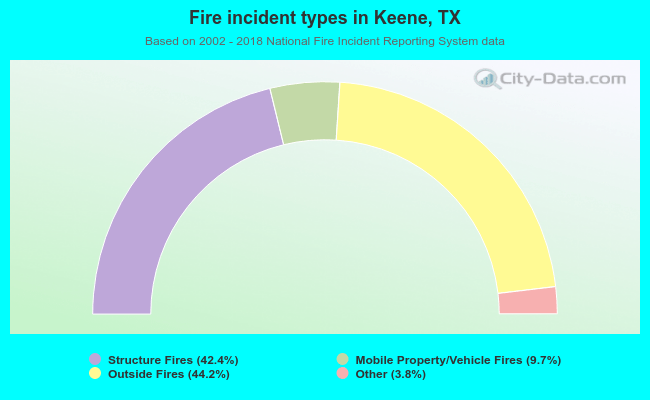 When looking into fire subcategories, the most incidents belonged to: Outside Fires (44.2%), and Structure Fires (42.4%).