Burleson: Fire Incidents, Texas (TX)
Where are fire incidents reported in Burleson, TX
Something went wrong! Please refresh the page.
| Fire incidents reported | |
|---|---|
| Sreet name | Count |
| BURLESON BLVD | 256 |
| WILSHIRE BLVD | 228 |
| RENFRO ST | 124 |
| ALSBURY BLVD | 102 |
| INTERSTATE 35W | 94 |
| MUTUAL AID BURLESON | 86 |
| WILSHIRE | 78 |
| MUTUAL AID - BURLESON | 76 |
| FM 917 | 72 |
| I35 | 72 |
| I-35 | 70 |
| JOHN JONES DR | 66 |
| RENFRO | 62 |
| BETHESDA RD | 50 |
| FM 731 | 42 |
| BRIAROAKS RD | 40 |
| BURLESON | 40 |
| CROSS TIMBER RD | 40 |
| FM 1902 | 40 |
| JOHN JONES | 40 |
| TARVER RD | 40 |
| CONVEYOR DR | 38 |
| CR 711 | 38 |
| I 35 | 38 |
| CR 809 | 36 |
| BETHESDA ST | 34 |
| CR 528 | 34 |
| CR 602 | 32 |
| CR 1016 | 28 |
| HIDDEN CREEK | 26 |
| Other | 1,525 |
2002 - 2018 National Fire Incident Reporting System (NFIRS) incidents
- Incident types reported to NFIRS in Burleson, TX
- 16,28954.0%Rescue & EMS
- 3,54711.8%Fire
- 3,49911.6%Hazardous Condition
- 2,9969.9%Good Intent Call
- 2,3937.9%Service Call
- 1,3604.5%False Alarm
- 520.2%Special Incident
- Fire incident types reported to NFIRS in Burleson, TX
- 1,84151.9%Outside Fires
- 1,16832.9%Structure Fires
- 46613.1%Mobile Property/Vehicle Fires
- 722.0%Other
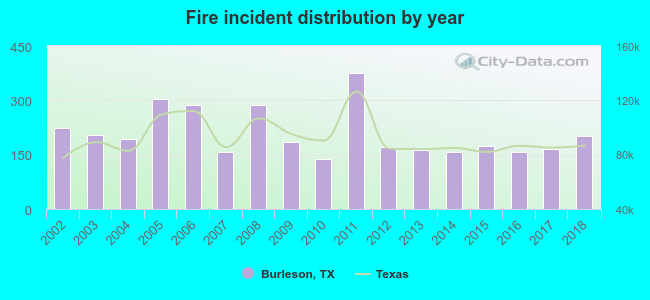 According to the data from the years 2002 - 2018 the average number of fires per year is 209. The highest number of fire incidents - 375 took place in 2011, and the least - 138 in 2010. The data has a dropping trend.
The average number of yearly fire incidents per 10k residents in Burleson, TX compared to nearest cities:
(Note: Based on data for the last 3 years, including only cities with population 5,000 and above)
| Burleson: | 41.9 |
| Crowley: | 48.7 |
| Rendon: | 22.8 |
| Joshua: | 141.1 |
| Everman: | 45.4 |
| Forest Hill: | 53.9 |
| Keene: | 99.7 |
| Kennedale: | 64.9 |
| Mansfield: | 22.7 |
 The median response time based on all reported fire incidents is 8 minutes. This is higher than the state median value.
The median response time in Burleson, TX compared to nearest cities:
(Note: Based on data for all years, including only cities with at least 500 fire incidents)
| Burleson: | 8 minutes |
| Crowley: | 6 minutes |
| Rendon: | 12 minutes |
| Joshua: | 11 minutes |
| Everman: | 6 minutes |
| Forest Hill: | 5 minutes |
| Keene: | 9 minutes |
| Kennedale: | 4 minutes |
| Alvarado: | 10 minutes |
 Based on the reports from the years 2002 - 2018 the average number of fire-related fatalities per year is 0. The highest number of deaths - 1 took place in 2003, and the lowest - 0 in 2002. The data has an increasing trend.
The average number of fatalities per 1,000 fires is 1. This indicator was the highest - 5 in 2018, and the lowest 0 in 2002. The trend for fatalities per 1,000 fires is growing. Compared to the state value the number of fatalities per 1,000 fires is lower.
Based on the reports from the years 2002 - 2018 the average number of fire-related fatalities per year is 0. The highest number of deaths - 1 took place in 2003, and the lowest - 0 in 2002. The data has an increasing trend.
The average number of fatalities per 1,000 fires is 1. This indicator was the highest - 5 in 2018, and the lowest 0 in 2002. The trend for fatalities per 1,000 fires is growing. Compared to the state value the number of fatalities per 1,000 fires is lower.Deaths per 1,000 incidents in Burleson, TX compared to nearest cities:
(Note: Based on data for all years, including only cities with at least 2,500 fire incidents)
| Burleson: | 0.8 |
| Alvarado: | 0.8 |
| Mansfield: | 0.7 |
| Cleburne: | 2.1 |
| Fort Worth: | 1.9 |
| Arlington: | 1.9 |
| Haltom City: | 1.4 |
| Midlothian: | 1.5 |
| Grand Prairie: | 3.9 |
 According to the data from the years 2002 - 2018 the average number of fire-related casualties per year is 1. The highest number of casualties - 4 took place in 2013, and the lowest - 0 in 2004. The data has a dropping trend.
The average number of injuries per 1,000 fire incidents is 4. This indicator was the highest - 24 in 2013, and the lowest 0 in 2004. The trend for casualties per 1,000 fires is decreasing. Compared to the state value the number of casualties per 1,000 incidents is much lower.
According to the data from the years 2002 - 2018 the average number of fire-related casualties per year is 1. The highest number of casualties - 4 took place in 2013, and the lowest - 0 in 2004. The data has a dropping trend.
The average number of injuries per 1,000 fire incidents is 4. This indicator was the highest - 24 in 2013, and the lowest 0 in 2004. The trend for casualties per 1,000 fires is decreasing. Compared to the state value the number of casualties per 1,000 incidents is much lower.
 27.5% incidents where reported in the morning and 72.5% in the evening. The most fires (15.9%) took place on Saturday, and the least (13.2%) on Wednesday.
 Based on the 3,547 incident reports from years 2002 - 2018 most fires (11.8%) took place during July, and the least (6.3%) in October.
 Out of all 30,176 cases reported during the years 2002 - 2018, the most belonged to the categories: Rescue & EMS (54.0%), Fire (11.8%), and Hazardous Condition (11.6%).
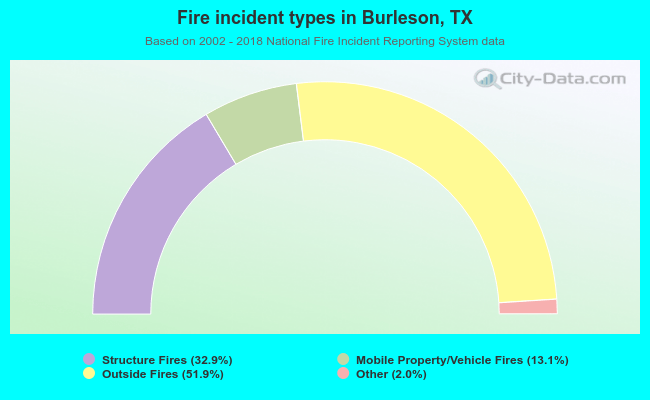 When looking into fire subcategories, the most reports belonged to: Outside Fires (51.9%), and Structure Fires (32.9%).