Keller: Fire Incidents, Texas (TX)
Where are fire incidents reported in Keller, TX
Something went wrong! Please refresh the page.
| Fire incidents reported | |
|---|---|
| Sreet name | Count |
| MAIN ST | 222 |
| KELLER PKY | 140 |
| RUFE SNOW DR | 78 |
| BOURLAND RD | 72 |
| BEAR CREEK PKY | 54 |
| MOUNT GILEAD RD | 48 |
| WHITLEY RD | 46 |
| JOHNSON RD | 42 |
| DAVIS BLVD | 38 |
| KATY RD | 38 |
| KELLER | 26 |
| KELLER PKWY | 26 |
| SHADY LA | 26 |
| WILLIS LA | 26 |
| BANCROFT RD | 24 |
| CHASE OAKS DR | 24 |
| KELLER HICKS RD | 24 |
| KELLER PKWY | 24 |
| KELLER SMITHFIELD RD | 24 |
| NORTH TARRANT PKY | 22 |
| VALLEY RIDGE DR | 22 |
| KELLER-SMITHFIELD RD | 20 |
| GOLDEN TRIANGLE BLVD | 18 |
| MAIN | 18 |
| SHADY GROVE RD | 18 |
| ALTA VISTA RD | 16 |
| BRENTWOOD TRL | 16 |
| FLORENCE RD | 16 |
| LAUREL VALLEY DR | 16 |
| MUTUAL AID-COLLEYVILLE | 16 |
| Other | 720 |
2002 - 2018 National Fire Incident Reporting System (NFIRS) incidents
- Incident types reported to NFIRS in Keller, TX
- 11,41553.8%Rescue & EMS
- 2,22010.5%Good Intent Call
- 2,18810.3%Service Call
- 1,9209.1%Fire
- 1,7048.0%Hazardous Condition
- 1,6617.8%False Alarm
- 590.3%Severe Weather
- 250.1%Special Incident
- Fire incident types reported to NFIRS in Keller, TX
- 96350.2%Structure Fires
- 73238.1%Outside Fires
- 1789.3%Mobile Property/Vehicle Fires
- 472.4%Other
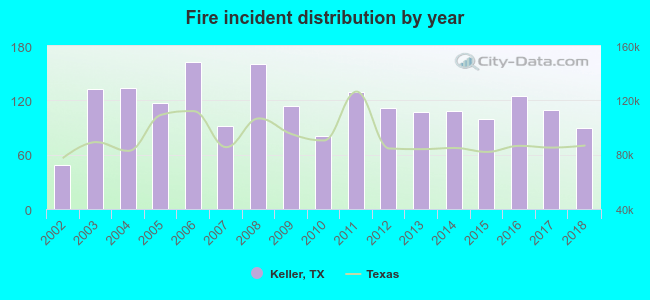 According to the data from the years 2002 - 2018 the average number of fires per year is 113. The highest number of reported fire incidents - 162 took place in 2006, and the least - 49 in 2002. The data has an increasing trend.
The average number of yearly fire incidents per 10k residents in Keller, TX compared to nearest cities:
(Note: Based on data for the last 3 years, including only cities with population 5,000 and above)
| Keller: | 24.5 |
| Watauga: | 29.2 |
| North Richland Hills: | 22.3 |
| Roanoke: | 57.8 |
| Southlake: | 28.4 |
| Trophy Club: | 24.9 |
| Colleyville: | 22.2 |
| Hurst: | 28.8 |
| Bedford: | 29.2 |
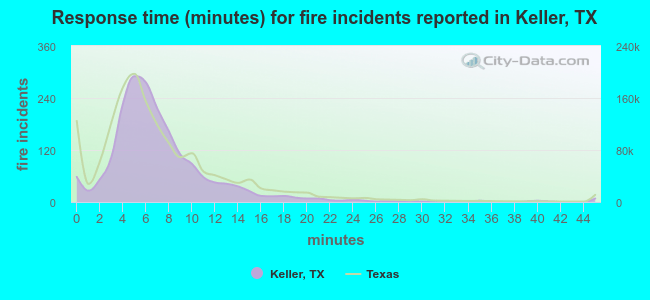 The median response time based on all reported fire incidents is 6 minutes. This is similar to the Texas median value.
The median response time in Keller, TX compared to nearest cities:
(Note: Based on data for all years, including only cities with at least 500 fire incidents)
| Keller: | 6 minutes |
| Watauga: | 6 minutes |
| North Richland Hills: | 6 minutes |
| Roanoke: | 5 minutes |
| Southlake: | 6 minutes |
| Colleyville: | 7 minutes |
| Hurst: | 5 minutes |
| Bedford: | 4 minutes |
| Haltom City: | 5 minutes |
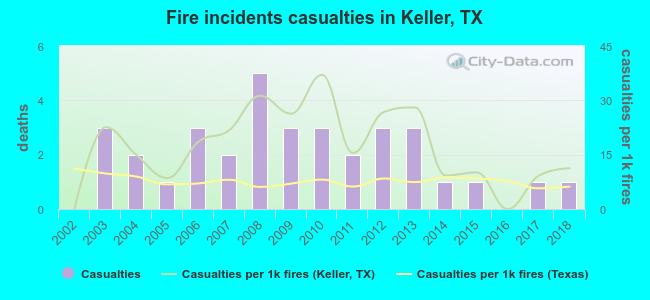 Based on the reports from the years 2002 - 2018 the average number of fire-related yearly casualties is 2. The highest number of reported injuries - 5 took place in 2008, and the lowest - 0 in 2002. The data has a rising trend.
The average number of injuries per 1,000 fires is 17. This indicator was the highest - 37 in 2010, and the lowest 0 in 2002. The trend for casualties per 1,000 fire incidents is rising. Compared to the Texas value the number of casualties per 1,000 incidents is much higher.
Based on the reports from the years 2002 - 2018 the average number of fire-related yearly casualties is 2. The highest number of reported injuries - 5 took place in 2008, and the lowest - 0 in 2002. The data has a rising trend.
The average number of injuries per 1,000 fires is 17. This indicator was the highest - 37 in 2010, and the lowest 0 in 2002. The trend for casualties per 1,000 fire incidents is rising. Compared to the Texas value the number of casualties per 1,000 incidents is much higher.Casualties per 1,000 incidents in Keller, TX compared to nearest cities:
(Note: Based on data for all years, including only cities with at least 500 fire incidents)
| Keller: | 17.7 |
| Watauga: | 3.6 |
| North Richland Hills: | 23.5 |
| Roanoke: | 7.2 |
| Southlake: | 2.4 |
| Colleyville: | 2.2 |
| Hurst: | 8.2 |
| Bedford: | 30.9 |
| Haltom City: | 6.0 |
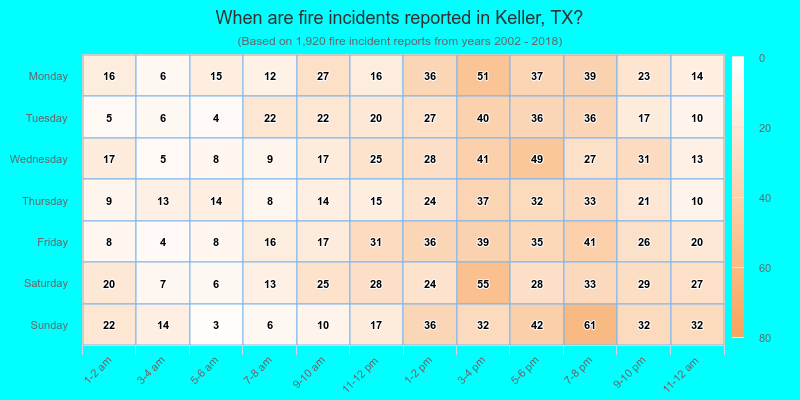
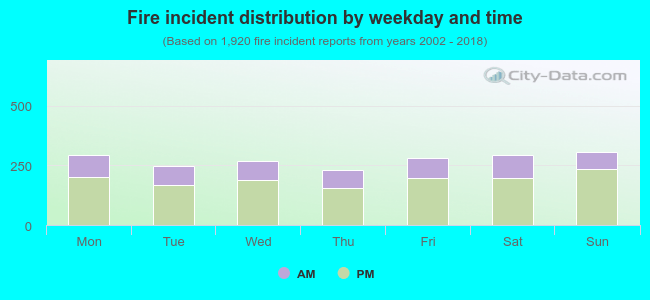 30.2% incidents where reported in the morning and 69.8% in the evening. The most fires (16.0%) took place on Sunday, and the least (12.0%) on Thursday.
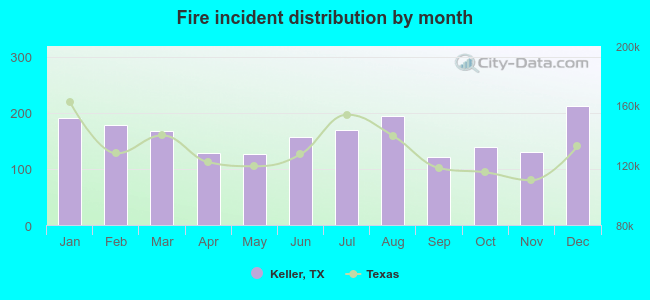 Based on the 1,920 fire incident reports from years 2002 - 2018 most fires (11.1%) took place during December, and the least (6.4%) in September.
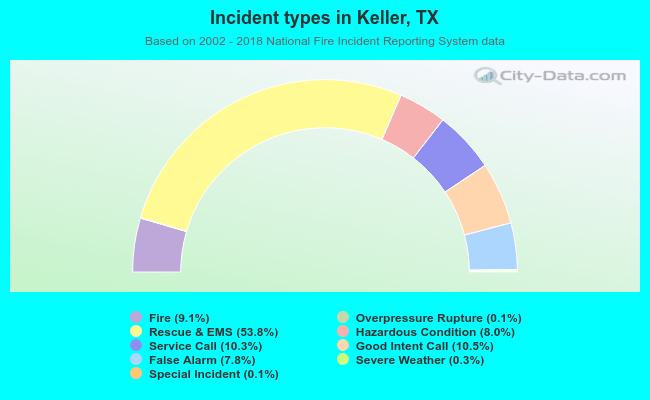 Out of all 21,210 cases reported during the years 2002 - 2018, the most belonged to the categories: Rescue & EMS (53.8%), Good Intent Call (10.5%), and Service Call (10.3%).
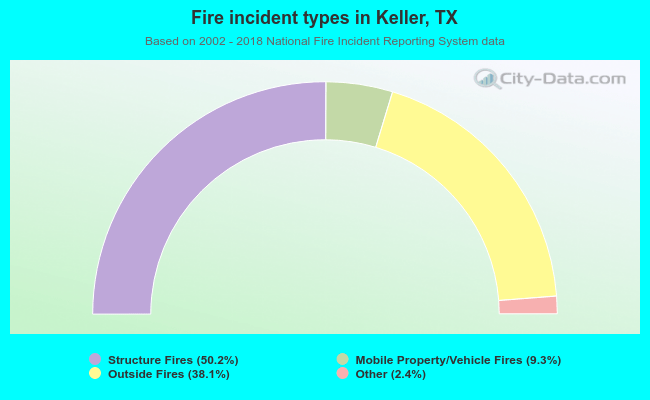 When looking into fire subcategories, the most incidents belonged to: Structure Fires (50.2%), and Outside Fires (38.1%).